Published on
June 15, 2026


If you want to spend capital better, a fractional CFO uses FP&A to give you a simple way to do it: use the same rules for every investment, update forecasts often, and review results against the original case.
In plain English, FP&A helps me answer three questions: Where should the next $1 go? What should stop getting funded? What changed since the last plan? That matters because companies that actively reallocate capital can be worth 40% more after 15 years than companies that mostly repeat last year’s spending mix.
Here’s the short version:
Bottom line: FP&A makes capital allocation more objective, more agile, and less driven by the loudest voice in the room.
If I had to reduce the whole article to one idea, it would be this: separate day-to-day spend from growth bets, compare those bets with the same yardstick, and keep reallocating as facts change.
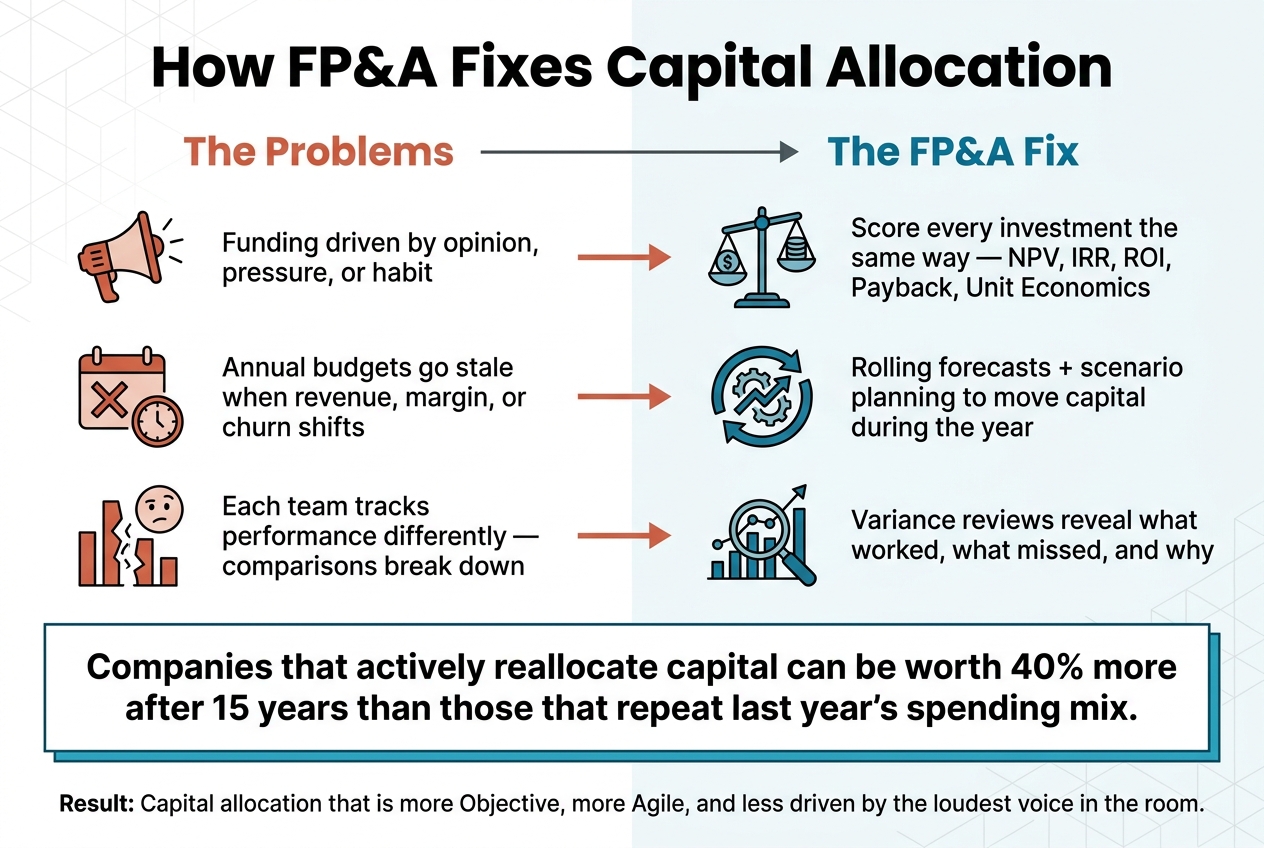
FP&A Capital Allocation: 3 Problems vs. 3 Fixes
Capital allocation tends to go off track when decision inputs are incomplete, inconsistent, or scattered across the business. FP&A helps fix that by using one set of criteria, one forecast, and one performance view. In practice, the same three problems show up again and again.
When a company lacks a standard way to judge investments, funding decisions often lean toward the loudest voice in the room, not the project with the best return. That's how equal-share budgeting happens: every department gets a "fair share" of the budget, even if its growth potential is far lower than another team's [2].
The result is pretty simple. High-upside initiatives get too little funding, while older programs keep their budgets by default. If teams aren't using clear criteria like payback, NPV, IRR, MOIC, or unit economics, capital decisions start to drift into politics.
And once that happens, changing course gets harder. If market conditions shift, leaders don't have a shared return framework to guide the next move.
Annual budgets are built on assumptions that often fall apart once the market changes. Revenue moves. Margins tighten. A key customer churns in the middle of the year. When that happens, a static budget doesn't give leaders much room to respond.
One common outcome is capital trapped in mature units. Companies keep capex high in business units that should be shifting into a harvesting phase, instead of moving that capital toward growth areas [2]. As Alejandro Erasso, Former Sr. Director Global Business Unit FP&A Finance at VMware, noted, capital allocation often changes only during annual planning or after deep unit reviews [1].
That point matters. Before leaders can reallocate capital with confidence, they need clean and consistent unit-level data, often managed through fractional CFO services.
Capital allocation also breaks down when each team measures performance in its own way. If one business unit uses one set of metrics and another uses something else, cross-unit comparisons get messy fast. Add fragmented spreadsheets and siloed data, and it becomes hard to separate maintenance spend from growth investment.
That slows decisions and can also skew them. Fragmented data feeds fixed assumptions and narrow local views, where managers rely on whatever information is easiest to access, even when it's incomplete or out of date [2]. It also makes it tougher to see which parts of the business are creating value and which ones are draining it.
These are the gaps FP&A is built to close through standard criteria, rolling forecasts, and variance reporting.
FP&A helps fix three common problems: funding based on opinion, budgets that go stale, and metrics that don’t line up across teams. It does that by giving leaders one way to judge investments, updating forecasts when conditions shift, and checking results against the original plan.
One of the first things FP&A improves is how teams compare investment ideas. If every proposal is judged on the same factors - NPV, IRR, ROI, payback period, and strategic fit - it gets much easier to compare projects side by side.
Strong FP&A teams often go a step further and use scoring models that look at several factors at once. That can include a project's growth potential, EBIT impact, market risk, and how much leadership time it will take. And that matters. A project can look great on IRR alone, but still be the wrong call if it pulls too much attention from leaders or doesn’t line up with the company’s direction.
Once every proposal runs through the same scoring model, leaders can compare expected returns across business units and make the next call with less guesswork.
A fixed annual budget has a clear weakness: it doesn’t adjust well when assumptions change. Rolling forecasts, updated monthly or quarterly, give leadership a current view of what’s tracking to plan and what’s starting to slip.
Scenario planning pushes that work further. By modeling base, upside, and downside cases, FP&A teams can estimate break-even points for key variables and spot the point where a project stops making sense. That gives management a way to move capital during the year with more confidence instead of waiting for the next planning cycle.
Used this way, variance reporting becomes a decision tool, not just something people review after the fact.
After capital is deployed, FP&A stays involved. Actual-versus-forecast analysis, often reviewed in quarterly business reviews, shows which investments are beating plan and which ones are missing it. That gives leaders a direct basis for action: put more behind what’s working, pause what isn’t, or shift spending to options with better expected returns.
The most disciplined teams don’t stop at asking whether a project came in on time and on budget. They go back to the original assumptions, dig into why the forecast missed, and use that lesson in the next decision. As one corporate strategy leader put it:
"We made our biggest losses from moves not made. So, we also explicitly review opportunity cost mistakes." - Head of Corporate Strategy, Industrial Conglomerate [2]
That feedback loop helps teams make the next capital decision with better judgment and a clearer view of trade-offs.
Strong FP&A makes capital allocation a repeatable process, not a one-off call. The next move is turning those tools into day-to-day habits. They only work when they’re built into unit-level metrics, a set review rhythm, and shared data.
Before leaders can decide where to put more capital, they need a clear read on which parts of the business are producing the best returns. That starts with unit-level metrics that show return and cash generation: contribution margin, ROIC, and free cash flow at the unit level, plus IRR and MOIC for individual investment cases. These metrics help teams see where to invest more, where to stay put, and where to pull cash out.
A useful way to frame this is to give each business unit a portfolio role: growth, core, or harvesting. That role should reflect both current returns and future potential. A harvesting unit, for instance, may be capped at only the spending needed to keep things running, while a growth unit can reinvest more of its own cash flow. [2]
Once leadership knows where returns are strongest, the next step is making reallocation routine. Strong FP&A teams don’t handle these calls in isolation. They bring decisions into set review meetings so the tradeoffs between projects are visible at the same time.
For a mid-market business, a practical cadence often looks like this:
| Review Type | Frequency | Key Participants | Focus |
|---|---|---|---|
| Performance Review | Monthly | FP&A, Business Unit Leads | Variance analysis and reallocation decisions, contribution margin, and operational KPIs |
| Investment Committee | Monthly/Quarterly | CFO, central committee, sponsor/challenger | Tradeoffs between new and existing projects, risk-return balance |
| Quarterly Business Review (QBR) | Quarterly | Leadership Team, FP&A | Unit economics, market share, and "go/kill" decisions for product lines |
| Strategic Planning | Annual | Board, CEO, CFO, FP&A | Portfolio roles, capital structure, and hurdle rates |
There’s one small process choice here that can make a big difference: every investment proposal should have a named sponsor and a named challenger. When both roles are assigned across functions, teams are less likely to fall in love with one idea and miss the downside. It’s a simple way to pressure-test assumptions before money gets committed. [2]
That review rhythm falls apart if the inputs are messy or disconnected. The base layer is an integrated planning model that gives FP&A one shared planning model.
Just as important, the model should be built around key operating drivers. In plain terms, the main assumptions need to sit out in the open, not hide inside formulas. When leaders can see those drivers, they can run what-if analysis fast and spot which variables matter most. And when those drivers move, it becomes much easier to tell which units should get more capital and which ones should move down the list.
It also helps to keep a small quarterly reserve in operating or R&D spend. That reserve gives teams some breathing room when the market shifts or a high-return opportunity shows up between planning cycles. No one wants to wait until the next annual plan to act on a strong opening. [3]
Phoenix Strategy Group works with growth-stage companies to build integrated financial models, FP&A processes, and data engineering that give leadership a clear view of where capital is going and what it’s returning.
The fix is pretty simple: make every capital decision measurable, reviewable, and adjustable. FP&A helps do that with standard investment criteria, rolling scenarios, and recurring performance reviews.
That discipline matters. Firms that practice active capital reallocation are worth 40% more after 15 years than firms that mostly repeat the prior year’s allocation [4].
Here’s why this works. Standard evaluation criteria cut bias in investment decisions. Scenario analysis gives leaders a way to see tradeoffs ahead of time, before small issues turn into bigger ones. Variance analysis closes the loop by showing what actually happened, so teams can learn and make better calls next time. That’s the job of a disciplined FP&A function.
For growth-stage companies, this matters most when capital decisions still lean too hard on instinct. A strong FP&A function adds visibility, accountability, and a clear review cadence so capital allocation becomes more objective and more agile.
Phoenix Strategy Group works with growth-stage companies to build FP&A infrastructure - integrated models, clear review processes, and the data foundation for defensible reallocation decisions.
Budgeting builds detailed financial plans for a set period. It focuses on revenue, expenses, and cash flow to help support day-to-day operations.
FP&A plays a broader role. It uses analysis and scenario modeling to guide capital allocation, assess opportunities, track performance, and support long-term growth.
Put simply, budgeting is one part of FP&A.
The most important capital allocation metrics are:
These metrics help you judge how well a business uses its money, how stable its finances look, and whether its growth can last.
Capital should be reallocated through regular reviews to keep strategy lined up with broader goals.
A simple review rhythm often works best:
This cadence helps teams move money where it can do the most good instead of letting old plans run on autopilot.