Published on
June 27, 2026


Most CAC mistakes come from one problem: using blended CAC to make channel budget calls. If I want to know where to spend the next dollar, I need channel-level math: fully loaded CAC, stage conversion, ACV, churn, LTV:CAC, and payback.
Here’s the short version:
If I were checking channels on 6/28/2026, I’d judge them on one simple question: does this channel still work after I count all costs and wait long enough for revenue to show up?
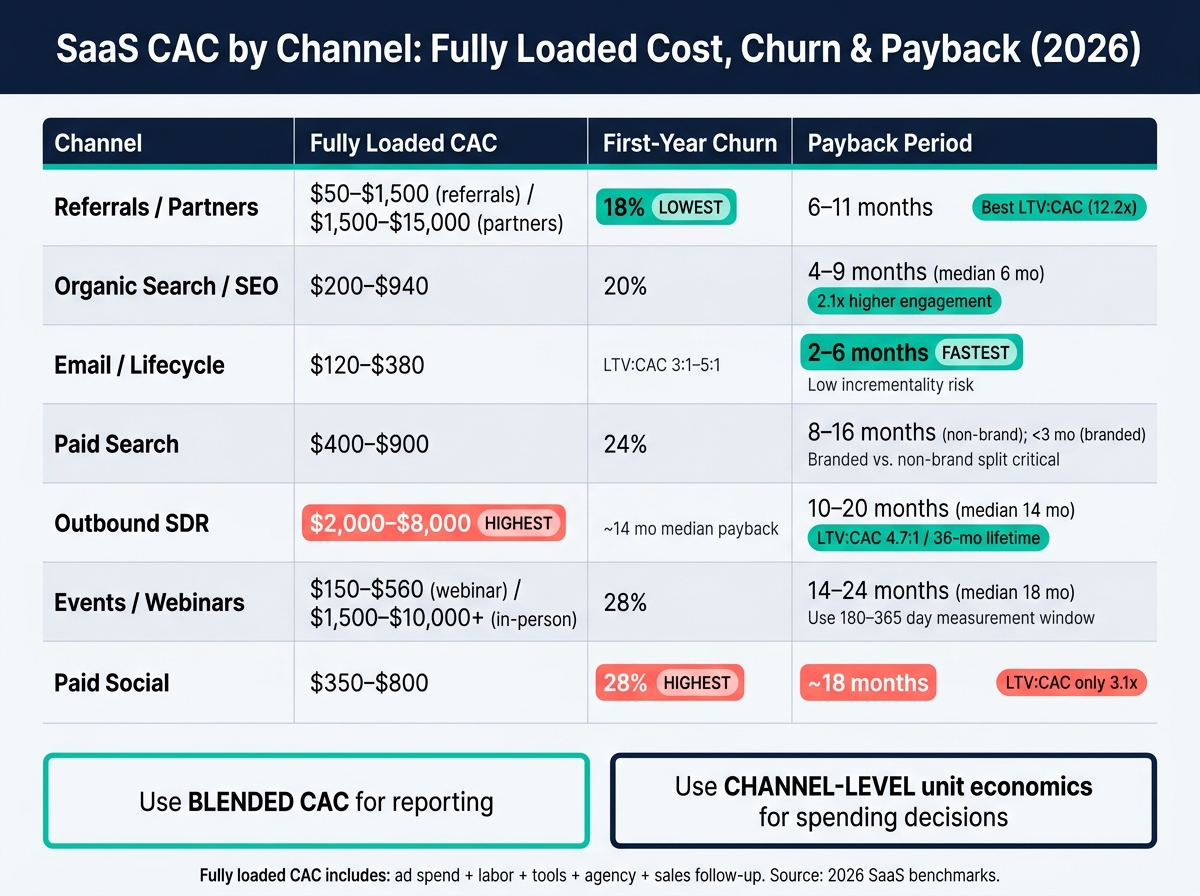
SaaS CAC by Channel: Fully Loaded Cost, Churn & Payback Compared
| Channel | Typical Fully Loaded CAC | Churn / Payback Pattern | Main Watch-Out |
|---|---|---|---|
| Organic search | $200–$940 | 20% churn, often 4–9 months payback | Time lag and misattributed “Direct” traffic |
| Paid search | $400–$900 | 24% churn, often 8–16 months for non-brand | Branded search can overstate channel strength |
| Paid social | $350–$800 | 28% churn, about 18 months payback | Low-intent leads and weak expansion |
| Outbound SDR | $2,000–$8,000 | About 14 months median payback | Headcount costs often left out |
| Events / webinars | $150–$560 webinar; $1,500–$10,000+ in-person | About 18 months payback | Long sales cycle skews short-window CAC |
| Referrals / partners | $50–$1,500 referrals; $1,500–$15,000 partners | 18% churn for referrals; about 6–11 months payback | Low volume and attribution overlap |
| Email / lifecycle | $120–$380 | Often 2–6 months payback | Last-click credit can inflate results |
Bottom line: I’d use blended CAC for reporting, but I’d use channel-level unit economics for spending decisions.
Organic search can look cheap at first glance. It isn't.
To price it the right way, you need to count the whole stack: content, SEO tools, analytics, CRM, and internal labor. If those costs sit outside your CAC model, organic will look better than it is.
"If you spend 10 hours a month writing SEO content and value your time at $100/hr, your organic channel costs $1,000/month - not $0." - Vincent Ruan, Founder, Attrifast [2]
When you load in those costs, fully loaded CAC for organic search in SaaS usually lands between $200 and $940 in 2026 [2].
That said, cost alone doesn't tell the story. Organic starts to matter when it brings in customers who stick around and use the product.
The case for organic on customer quality is strong. Organic search customers show 2.1x higher early engagement than the average across all channels, and first-year churn is about 20%, compared with 28% for paid social [6].
Slack saw the same pattern at a deeper level. Its organic-led teams had 2.5x higher LTV than paid channels, which is why the company capped paid acquisition at about 20% of new logos [8].
Organic payback usually falls between 4 and 9 months, with a 6-month median [6]. Lower churn keeps improving the math over time.
But there's a catch: content doesn't work on a same-month clock. It often takes time to show up in the pipeline. March content spend may drive May signups, and if you force both into the same month, your CAC math gets skewed [4].
In plain English, timing matters as much as spend.
This is where things get messy. Only 10% to 15% of GA4 "Direct" traffic is actually direct. The rest is often misattributed organic, brand, or untracked social sharing [2].
So if you treat Direct as its own CAC channel, you're blending different traffic sources into one pile. That's a bad setup if you're trying to see what's working.
A simple fix is to ask customers directly after purchase: "How did you first hear about us?" That kind of survey can help surface where those customers first came from [8].
Paid search CAC often looks lower than it is. The usual reason is simple: teams count ad spend, then leave out the rest. But the full cost includes Google Ads spend, agency retainers, your SEM manager’s salary, internal labor, tools, and SDR follow-up. Skip those pieces, and you can understate real CAC by 20% to 40% [1][9].
The question isn’t just, “What did we spend on ads?” It’s whether the full spend turns into enough SQLs and revenue to make the math work.
"A $50K/month paid search budget with one $120K/year SEM manager managing it has a real cost of $60K/month - not $50K. Founders systematically under-report by ignoring people cost." - KnowMBA [8]
In 2026, the median SaaS paid search CAC falls between $400 and $900 [2]. But that number only means something in context. CAC tolerance depends on ACV. A $4,000 CAC is hard to support for SMB SaaS with $1,000 to $15,000 ACV, but it can make sense for enterprise deals with $50,000+ ACV [5].
Not all paid search traffic behaves the same way. Branded search converts at 8% to 15%, while high-intent nonbrand queries convert at 3% to 6% [10]. That gap matters.
Branded search usually picks up demand that other channels already created. So while it may look strong on paper, it isn’t bringing in net-new demand in the same way. If you blend branded and nonbranded spend into one number, paid search can look stronger than it is. That’s why conversion rate alone doesn’t tell the whole story. You also need to look at retention and payback.
For B2B SaaS, cost per SQL is often the cleaner mid-funnel check. In 2026, cost per SQL usually sits between $800 and $2,500 [5]. If your close rates are weak or your deal sizes are too small, that math falls apart fast.
Paid search customers churn at about 24%, compared with 18% for referrals [6]. A six-point gap may not sound huge at first, but it stretches payback even when upfront CAC looks similar.
Non-branded transactional campaigns usually pay back in 8 to 16 months [10]. Branded campaigns can pay back in under 3 months, but that result often comes from demand built somewhere else. In other words, branded paid search can look like a star player when it’s mostly finishing the play.
If CAC goes up for three straight months, that’s a sign the channel is saturating.
Paid search works best as a demand-capture channel, not a demand-creation one.
Paid social is a demand creation channel. That means the ad itself does a lot of the heavy lifting, so creative quality matters more here than it does in search.
It also tends to look cheaper on paper than it is in practice. A fully loaded paid social CAC should include media spend, creative work, management time, tools, and sales follow-up. Miss those costs, and CAC can be understated by 40% to 70% [14]. So the job isn’t just to ask, “What does paid social cost?” You also need to look at conversion, ACV, churn, and payback.
"Stop bundling sales compensation into 'marketing spend.' These are different cost structures... Budgeting them together hides when you've hit the inflection point where hiring more sales capacity no longer makes sense." - Seth Girsky, Founder, Inflection CFO [1]
Paid social can drive a lot of top-of-funnel volume. The catch is that it often brings in lower-intent buyers, and that tends to show up in weaker revenue quality later on.
The median ACV for customers acquired through paid social is $1,800, compared with $3,200 for referral-acquired customers [6]. Expansion tells a similar story: only 23% of paid social customers expand in the first six months, versus 42% for referrals [6].
For B2B SaaS, paid social CAC on Meta and LinkedIn usually falls between $350 and $800 [2]. And if you’re trying to improve that number, creative is the main lever. Creative can shift CAC by 30% to 60%, while bid and targeting changes usually move it by only 5% to 15% [14].
That gap matters. Lower ACV and weaker expansion may not jump out right away, but they show up later in payback.
Paid social has a 28% first-year churn rate. That’s higher than referrals at 18%, organic search at 20%, and paid search at 24% [6]. As a result, the median payback period stretches to 18 months - three times longer than referral or organic search channels [6].
You can see how this plays out in the field. One B2B SaaS company cut blended payback from 14 months to 11 months by freezing paid social and moving spend to content and partners. Paid social by itself had been running at 34 months [12].
A few numbers are worth watching closely:
Paid social can still do a job, but only if the creative stays fresh and payback doesn’t drift out too far.
Outbound sits on the high-CAC end of the channel mix. So the key question isn’t just cost. It’s whether long-term customer value clears the bar.
Outbound SDR CAC often looks lower than it is because teams skip SDR labor in the math. That leaves out a big chunk of the spend. To get a more honest number, include SDR base salary, commissions, benefits, tools, data, and acquisition-linked AE comp. When you do, fully loaded outbound CAC usually falls between $2,000 and $8,000 per customer in 2026 [5]. Where you land in that range mostly comes down to ICP precision, data quality, and rep output [5].
Booked meetings can look nice on a dashboard, but they don’t tell you much on their own [5]. Qualified opportunities and closed-won deals matter more. That means you need to track the full path from first reply all the way to retained customer, not just meetings booked [5].
What counts is the conversion rate across each step:
Outbound also tends to bring in higher-value buyers. Outbound customers show a 36-month average customer lifetime, compared with 12 months for paid search customers, along with an LTV:CAC ratio of 4.7:1 versus 4:1 for paid search [15]. That gives outbound more room to support a higher CAC when it leads to longer retention and higher LTV. But there’s a catch: higher CAC only works when ICP fit is tight.
Outbound has a median payback period of 14 months, with an interquartile range of 10–20 months [6]. Enterprise deals can push that out to 18–24 months [1][5]. Timing matters here. Use a trailing 90- to 180-day window that lines up with when the lead was sourced and the month the deal closed-won [15][5]. If you match everything in the same month, you’ll undercount outbound CAC.
That’s why outbound works well as a quality benchmark, often requiring the oversight of fractional CFO services to manage these high-CAC investments. It costs more, so it should earn that extra spend through deal size, retention, and payback discipline.
Events are expensive, and teams often undercount what they cost. If you leave out SDR follow-up, you can hide 30% to 50% of true CAC [5]. A fully loaded event CAC should include sponsorships, venue or platform fees, travel, lodging, production, staff time, and the share of SDR and AE follow-up tied to the event.
Once you count all of that, in-person event CAC usually lands between $1,500 and $10,000+ per customer [5]. Webinars are often cheaper, closer to $150 to $560 per customer, but that only tells the full story if you also assign audience-building and content production costs [2][5]. That delay is one big reason events need longer measurement windows than capture channels.
Registrations and attendance can look nice in a report, but they don't tell you much on their own. The real test is whether attendees move from attendee to SQL to closed-won.
With 211-day sales cycles and 76 touchpoints, event-driven deals often close months later. That means last-touch attribution tends to miss a big part of the channel's impact [5].
Use a 40/60 hybrid model to split first-touch and last-touch credit more fairly [4]. It also helps to track cost per SQL for each event. In high-value verticals like cybersecurity, that figure can hit $3,500 per SQL and still make sense if ACV is high enough [5].
Event tests only make sense when you measure conversion after the sales cycle has had time to play out. Events have a median payback period of 18 months with an IQR of 14 to 24 months, plus a first-year churn rate of about 28%. That's higher than referrals at 18% and organic search at 20% [6].
That churn gap matters. Even when the upfront CAC looks fine, higher churn stretches the effective payback period. Event-sourced customers often show lower intent than referral customers, and that tends to show up later in retention data.
Because there's such a long gap between event spend and closed revenue, use a 180-day or 365-day rolling window for CAC calculations, not a 30-day snapshot [5]. A month-by-month view can make the channel look all over the place. The measurement window should match the sales cycle.
Referrals and partners often look better than paid channels once you load in the full cost. That’s the key point here.
Referrals tend to be the low-cost benchmark. Partners usually cost more, but they can keep growing after referrals start to hit a ceiling.
A lot of teams make referrals look cheaper than they are. Referral CAC only tells the truth when you include everything tied to the program:
Miss those items, and you can hide 30% to 50% of true CAC [13][5].
Referral CAC usually falls between $50 and $1,500. Partner CAC is often $1,500 to $4,000, and for enterprise it usually lands around $5,000 to $15,000 [13][6].
Partnership-sourced leads close 40% faster than paid search leads. They also need less implementation support. Referral customers show 2.1x higher early engagement than the average [13][6].
The revenue picture is stronger too. Median ACV for referral customers is $3,200, versus $1,800 for paid social. On top of that, 42% of referral customers expand within six months. The average across all channels is 23% [6].
That extra expansion pushes LTV up.
Referrals post the lowest first-year churn of any channel at 18%. Paid search comes in at 24%, and paid social at 28%. Median payback for referrals is 6 months, compared with 11 months for partnerships and 12 months for paid search. Across a 36-month window, referral channels can reach a 12.2x LTV:CAC ratio, while paid social sits around 3.1x [6].
"Referral and organic search channels deliver the fastest payback: Median payback of 6 months... versus 18 months for paid social." - MCP Analytics [6]
There is a catch. Low referral CAC doesn’t mean unlimited volume. Referrals are hard to scale. Partners can go farther, but they come with higher cost and a longer setup cycle.
That’s why CAC math here needs a longer lens. Use rolling 180-day windows for partnership CAC on slower sales cycles, and run incrementality tests before moving major budget into these channels [13][8][5][6]. Some of that demand would have converted anyway.
And even strong numbers can fool you if attribution misses where demand started. That’s where channel tests often send teams in the wrong direction.
Email and lifecycle marketing can seem like the cheapest channel in the mix. Sends cost almost nothing, so the math looks great at first glance.
But that’s also where teams get tripped up.
Unlike demand-gen channels, email usually monetizes leads that are already in your system. So if you credit email for all of that revenue, CAC can look far lower than it is.
"The marginal CAC is near zero; the upstream cost (audience-building) is what matters and gets allocated to the channel that built the list." - Todd Chambers, CEO & Founder, Upraw Media [5]
The main cost isn’t the send. It’s everything behind the send that teams often leave out.
A fully loaded email CAC should include:
Leave those out, and you can undercount true CAC by 40–60% [16]. In 2026, the SaaS benchmark for fully loaded email marketing CAC is $120 to $380 per customer [2].
Cheap sends don’t save you if the list is weak or your attribution model is messy.
Track conversion based on paying customers, not trials or signups [2]. That sounds simple, but it changes the picture fast.
Last-click attribution tends to over-credit email because it gives all credit to the final touch. A 40/60 first-touch/last-touch split gives a cleaner view and helps prevent inflated email numbers [4]. In plain English: email performance depends a lot on who joined the list to begin with.
Lifecycle programs often pay back in 2 to 6 months, with a healthy 3:1 to 5:1 LTV:CAC [2].
Still, high open rates and dirt-cheap sends don’t mean much if churn eats the margin. The only way to check whether lifecycle-sourced customers are better is to track retention by acquisition channel [13].
You also need incrementality testing. A 10% to 15% holdout test helps show how much revenue email is causing versus how much it’s just touching right before a high-intent user converts [3]. For example, if holdout conversion is 2.1% and exposed conversion is 3.8%, then only 44.7% of attributed email revenue is actually incremental [3].
That’s where channel tests start giving you false signals.
Most channel tests fail for a pretty simple reason: teams track the wrong metric over the wrong time frame. The issue usually isn't bad data. It's bad reading of that data.
A channel test only means something when you look at blended CAC, fully loaded CAC, conversion depth, and payback together. That's why channel testing is as much about timing and attribution as it is about cost.
Three traps show up again and again:
A low CPL can look great on the surface and still lead to CAC above $2,000 once you factor in close rates and sales effort [5]. Last-click attribution tends to give too much credit to retargeting and branded search. And a 30-day window can make a long B2B sales cycle look like random noise [5].
Blended CAC can mislead too. A company may report a healthy average while hiding a $200 search CAC sitting next to a $1,200 SDR CAC [1]. That average smooths over a broken channel mix. So the channel numbers matter only if the test itself is set up the right way.
After iOS 14, both Meta and Google began modeling conversions they can't directly verify [14]. That changed how platform data should be read. Platform-reported ROAS is, on average, 2.1x higher than true incremental ROAS, and the gap gets even larger for retargeting, reaching 3.4x [3]. As Dan Barnes, President of MAVAN, put it:
"The honest answer to how do you know the attribution is real is that you don't rely on platform-reported attribution. You run holdout tests on a rolling basis." [11]
These false signals don't look the same in every channel. They show up in different ways, and each one needs a different fix.
| Channel Pattern | False Signal | Corrective Action |
|---|---|---|
| Retargeting | High ROAS / Low CAC | Run incrementality holdout tests; use 1-day click only [3] |
| Brand Search | 10x+ ROAS | Test turning off brand spend in specific geos to measure lift [11] |
| Paid Social | Low CPL | Track stage-by-stage conversion to closed-won [5] |
| Content / SEO | High CAC (short-term) | Use 180-day rolling windows and multi-touch attribution [5] |
| Outbound SDR | Low CAC (reported) | Calculate fully loaded CAC including all headcount [8] |
| "Free" Organic | Near-zero CAC | Allocate fully burdened labor costs to the channel [2] |
Phoenix Strategy Group helps growth-stage firms tie channel tests to cohort-level CAC and full unit economics.
With these failure modes in mind, the next section compares each channel's upside and tradeoffs.
Once you remove the noise, the next step is simple: figure out which channel tradeoffs match your cash, ACV, and sales cycle.
No channel wins across the board. Each one gives you something and takes something away. Referrals tend to deliver the best CAC and lead quality, but they hit a ceiling fast. Paid search reaches active buyers fast, but CAC has climbed hard and it only works when demand already exists. Organic search builds over time. Paid social can scale faster, but it also tends to churn faster. Outbound and events can pay off, though only when ACV and sales cycle make the math work.
The table below cuts each channel down to three things: its main upside, its main limit, and where it fits best.
| Channel | Strongest Upside | Biggest Limitation | Best Fit |
|---|---|---|---|
| Referrals | Lowest CAC ($50–$200); highest lead quality [8][6] | Hard to scale; volume ceiling | Early-stage validation; cash-constrained growth [6] |
| Organic Search / SEO | Compounding returns; low marginal CAC at scale [1] | Slow to start; 6–18 month payback [6][2] | Long-term efficiency and authority building [1] |
| Paid Search | High intent; captures active buyers fast [1] | CAC rising; high cost in competitive categories [2] | Capturing existing demand for known solutions [1] |
| Paid Social | Precise targeting; high volume [1] | 28% first-year churn; ~18-month payback [6] | Awareness and mid-funnel scaling [1] |
| Outbound SDR | Reaches enterprise accounts [1] | Highest fully loaded CAC ($1,000–$5,000+) [8] | Complex sales with high ACV [1] |
| Events | Relationship-driven demand [6] | Slow payback; high upfront cost [6] | Strategic awareness; enterprise deal support [6] |
| Email / Lifecycle | Low-cost reach to existing leads [4] | Requires an established list; low incrementality for active users [4] | Retention and LTV maximization [4] |
One guardrail matters here: don’t let any single channel drive more than 40% of new customers [8]. If too much growth comes from one source, you’re building on thin ice.
Across organic, paid, outbound, events, referrals, and lifecycle, the pattern stays the same: the best channel test isn't the one with the lowest CAC on paper. You need to judge each channel on the full picture, including fully loaded CAC, stage conversion, revenue per customer, low churn, and a payback period your cash position can actually handle [1][7].
Use blended CAC for reporting. That's the reporting standard. But spending decisions are a different story. For budget calls, use channel-level unit economics.
As Dan Barnes, President of MAVAN, put it:
"Marginal for decision-making, blended for reporting. Marginal tells you whether the next dollar is worth spending. Blended tells you how the overall machine is performing." - Dan Barnes, President, MAVAN [11]
That distinction matters. Blended CAC can lump a low-cost channel next to a high-cost one, and you may never see which channel is dragging performance down [1][2].
A simple rule helps cut through that noise: if a channel stays above 120% of blended CAC for three straight months, dig into it and verify incremental lift with quarterly holdout tests [4][3].
Channel testing also can't be a one-and-done exercise. It needs to stay in motion, especially since paid CAC rose 40% to 60% from 2023 to 2026 [2].
Blended CAC is your total marketing spend divided by your total new customers. It gives you a top-level view of business health, which is why teams often use it in investor reporting. But there’s a catch: it can hide what’s happening inside each channel.
Channel CAC looks at the cost to acquire a customer from a single source, like paid search, social media, or referrals. Use blended CAC to understand the big picture. Use channel CAC when you need to make day-to-day operating decisions.
Use this formula: (total channel spend + allocated shared costs) / new customers acquired through that channel.
That means you should count direct costs, along with allocated salaries and shared platform or overhead costs.
Also, stick with one attribution model the whole way through. And match spend to the customer cohort it brought in, instead of relying on calendar-month totals.
Referral programs and organic search usually pay back the fastest, with a median timeline of about 6 months. That makes sense. Both channels tend to come with more trust and lower upfront costs than paid acquisition.
Paid social and conferences are a different story. They often take much longer to earn back what you spent, and in many cases, that timeline stretches to 18 months or more.