Published on
June 27, 2026


If your CPG sales are up but profit feels tight, margin is probably leaking in a few plain places: COGS, trade spend, channel mix, freight, and retailer deductions. I’d focus on six numbers first: gross margin %, contribution margin %, trade spend %, deduction rate, freight-to-customer, and customer-level profit.
Here’s the short version:
A fast way to think about it is this: margin erosion usually comes from cost shifts, promo and mix pressure, or post-sale leakage. If I can see those three areas clearly, I can act before a good sales month turns into a weak profit month.
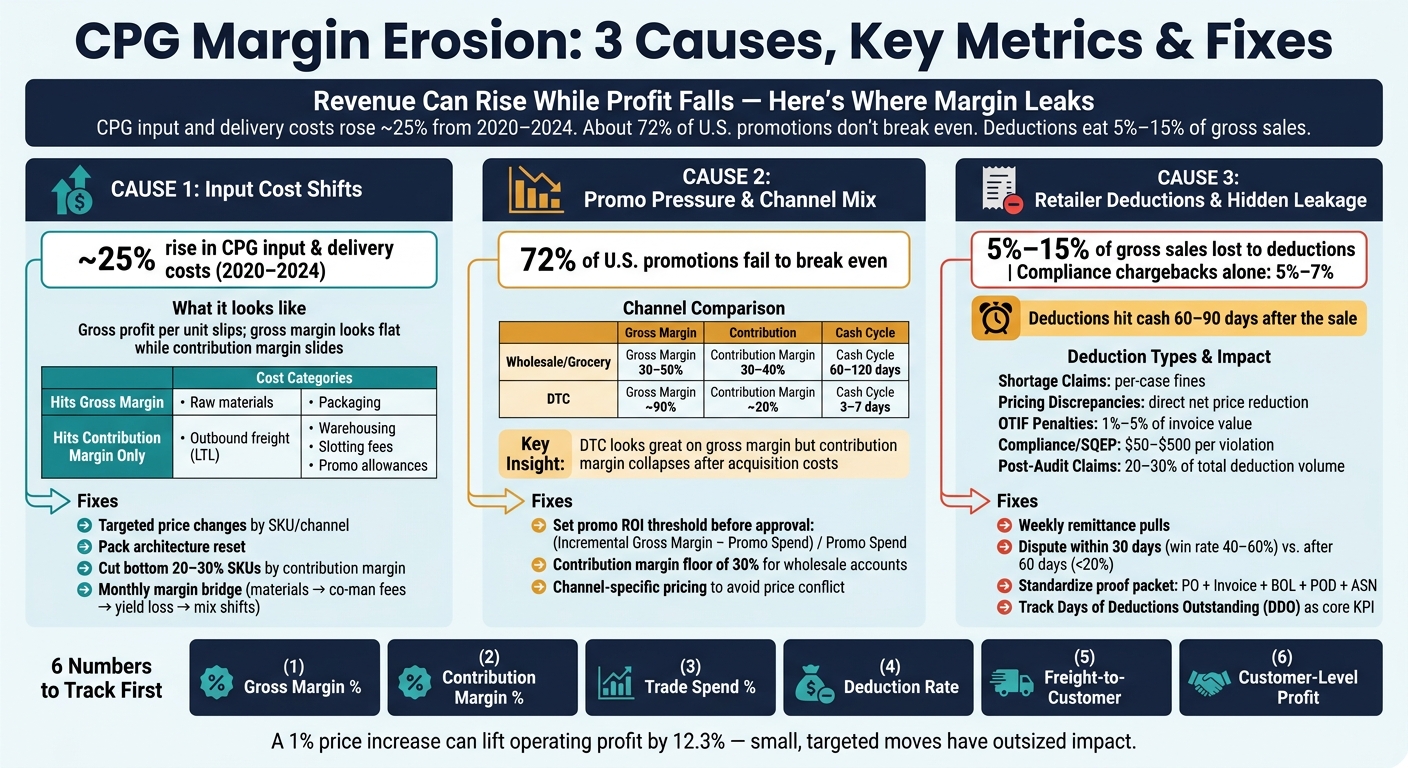
CPG Margin Erosion: 3 Causes, Key Metrics & Fixes
| Margin pressure | What it looks like | What I’d check first | Common fix |
|---|---|---|---|
| Input costs | Gross profit per unit slips | COGS by SKU, co-man fees, yield loss | Targeted price changes, pack reset, SKU cuts |
| Promo and channel mix | Revenue up, contribution down | Trade spend %, sell-through, customer margin | ROI rules, channel pricing, margin floors |
| Deductions and chargebacks | Cash collected trails booked revenue | Deduction rate, DDO, claim types | Weekly reconciliations, dispute packets, root-cause fixes |
The main point is simple: margin problems are easier to fix when I track profit by SKU, customer, and channel - not just at the company level.
When you can see both gross margin and contribution margin, it gets much easier to tell two different problems apart: input-cost inflation and cost-to-serve leakage.
CPG input and delivery costs rose by about 25% from 2020 to 2024, pushed up by ingredients, packaging, energy, and labor [7]. But that pressure doesn’t land evenly across the business. A product with resin-heavy packaging and exposure to less-than-truckload freight (LTL) gets hit in a very different way than a high-velocity SKU with lower service costs.
Here’s the part that trips people up: product cost inflation flows straight into COGS. That includes ingredients, packaging materials, and co-manufacturer fees. Service-cost inflation - like freight, storage, and compliance costs - often sits outside COGS in SG&A or shows up as deductions. So gross margin can look flat, even while contribution margin starts sliding in the background.
The table below shows where those costs land, and why gross margin misses a big part of the story:
| Cost Category | Hits Gross Margin? | Hits Contribution Margin? |
|---|---|---|
| Raw materials / ingredients | Yes | Yes |
| Packaging (resin, paper) | Yes | Yes |
| Outbound freight (LTL) | Rarely | Yes |
| Warehousing / storage fees | Rarely | Yes |
| Slotting fees | No (revenue reduction) | Yes |
| Promo allowances | No (revenue reduction) | Yes |
Broad price hikes are a blunt tool. They can hurt volume without fixing the SKUs and channels where cost pressure is highest. A better move is targeted pricing - adjusting by category, pack size, or channel based on where margin is getting squeezed the most.
Pack architecture is another lever that often gets missed. Smaller pack sizes at lower price points, or a reset of a "Good/Better/Best" lineup, can help protect shopper price perception while holding onto dollars per unit [6][4].
It’s also worth taking a hard look at the bottom 20% to 30% of SKUs by contribution margin. Every extra SKU adds setup time, storage, and QA costs that often don’t show up in standard product costing. Cutting the weakest ones can free up working capital and make operations simpler [8].
A simple monthly margin bridge can help isolate what’s driving the drop:
If costs look stable but margin still keeps slipping, the next place to look is promo pressure and channel mix.
If input costs are flat but margin still slips, the next place to look is usually promotions and channel mix.
Trade spend is often one of the biggest variable drains on margin in a CPG P&L. About 72% of U.S. promotions fail to break even [2].
The big issue is simple: many teams optimize for sell-in, not incremental sell-out. Retailer shipments can look strong on paper, but that doesn't tell you whether shoppers bought more or just bought earlier. To see what actually happened, track consumer sell-through. That's the metric that shows whether a promotion created new demand or just moved demand around the promo window [1].
There's another trap here too. Promotions can shift volume away from higher-margin SKUs and shrink total contribution margin. So one promoted item may look profitable on its own while quietly taking dollars from the rest of the portfolio.
"Trade spend is contra-revenue... It does not belong down in the marketing or SG&A section of the P&L." - Matt Putra, Managing Partner, Eightx [10]
Under ASC 606, trade spend reduces revenue. It is not a marketing expense.
Channel growth doesn't just change margin. It also changes fees, payment timing, and service costs.
| Channel | Gross Margin | Contribution Margin After Fees | Cash Cycle |
|---|---|---|---|
| Wholesale / Grocery | 30%–50% [3] | 30%–40% [10][3] | 60–120 days [3] |
| Direct-to-Consumer (DTC) | ~90% [3] | ~20% [10][3] | 3–7 days [3] |
This is why gross margin on its own can mislead. It misses fee drag and cash timing. Contribution margin gives a better read on the tradeoff.
"The contribution margins through retail are better than most people think. You can pull off 30 to 40% if you have a good product through grocery, even with the trade spend. In DTC you have to acquire the customer every time." - Matt Putra, Managing Partner, Eightx [10]
Working capital is part of this story too, and it's where many brands get blindsided. DTC usually brings in cash within 3 to 7 days, while wholesale often runs on Net 30 to Net 90 terms [3]. So a fast move into retail can tighten cash even when revenue is moving up.
A practical fix is to set a promo ROI threshold before any event gets approved. The formula is simple: (Incremental Gross Margin – Promotional Spend) / Promotional Spend [5]. If an event falls below the floor, it shouldn't run. And if a promotion starts underperforming, there should be a clear trigger to stop it mid-flight [2][5].
"If there is no mechanism to act on mid-quarter ROI data, the data is decorative." - Kenneth Fick, FP&A Professional [2]
On the channel side, a contribution margin floor of 30% for wholesale accounts gives finance a clean rule to work with. If an account stays under that line, the next step is either to renegotiate terms or walk away [3][10]. Channel-specific pricing can also help protect margin without setting off price conflict across accounts.
Even with tighter promo rules, margin can still leak through retailer deductions and chargebacks.
Even when promo and channel controls get tighter, deductions can still chip away at collected revenue. The nasty part is timing: deductions usually hit cash 60 to 90 days after the sale. By the time they show up, margin pressure may already be building.
And this isn’t small change. Deductions usually eat up 5% to 15% of a CPG brand’s gross sales [11][12]. Compliance chargebacks alone can make up 5% to 7% of gross sales [12].
Most deductions land in three groups: trade deductions, compliance chargebacks, and post-audit claims. The last two tend to drive the hidden leakage. Big retailers now automate many of these fines through OTIF and SQEP rules tied to labeling mistakes and timing issues.
Here’s where things usually go wrong, and what helps stop it.
| Deduction Type | Likely Root Cause | Prevention Step | Margin Impact |
|---|---|---|---|
| Shortage Claims | Incorrect receiving counts; documentation gaps | Photograph pallets; ensure the BOL is signed at pickup | Per-case fines [3] |
| Pricing Discrepancies | Mismatch between agreement and EDI setup | Sync promotional terms across systems before launch | Direct reduction of net price [14] |
| OTIF Penalties | Late delivery; routing guide deviations | Use authorized carriers; confirm POs in routing portals | 1%–5% of invoice value [11] |
| Compliance / SQEP | Shipping errors, invalid ASNs, missing labels; barcode placement; incorrect GTIN data | Audit item files quarterly; test barcode scanability | $50–$500 per violation [3] |
| Post-Audit Claims | Historical pricing or promo errors found by third-party auditors | Maintain shipment documentation and file disputes within retailer windows | 20%–30% of total deduction volume [13] |
"If deductions are rising faster than sales, you have an operational story - not a finance story." - Jon Allen, CPG Broker [11]
Start with weekly remittance pulls. Dispute windows close fast, and the drop-off in win rates is steep. Well-documented disputes filed within 30 days win at 40% to 60%, but after 60 days that falls below 20% [13].
It also helps to standardize a proof packet for every shipment:
That one step cuts down the back-and-forth that slows dispute filing.
Clear ownership matters too. If nobody owns the issue, deductions just keep coming back around. Pricing and promo disputes should sit with Sales. Routing and labeling failures belong to Logistics. Finance should handle triage and tracking [11].
A meaningful share of deductions is invalid and recoverable [13]. That’s why Days of Deductions Outstanding (DDO) should be treated as a core KPI. It gives Finance an early warning before deductions pile up.
Once these controls are running, fold them into a monthly margin-review cadence.
Once deduction controls are in place, margin needs a set review rhythm so small issues don't snowball. The goal is simple: keep problems visible while there's still time to fix them.
Use the same metrics from earlier - gross margin, contribution margin, trade spend, and deductions - so each review leads to action. On a monthly basis, review contribution margin by SKU and customer segment to spot mix drift or cost creep early [9]. On a quarterly basis, review customer profitability and compare list price with realized price [9][15]. Annually, rationalize the portfolio by repricing, redesigning, or discontinuing low-contribution SKUs [9].
Track four views in every review:
And don't stop at company-level summaries. In review meetings, look at these views by SKU, customer, and channel. That's where margin loss usually shows up first.
The process matters just as much as the numbers. A cross-functional margin review - where sales, procurement, and finance look at SKU-, customer-, and channel-level margin together - helps keep pricing decisions tied to realized customer pricing [5].
Input costs, promo pressure, channel mix, and deductions don't hit margin one at a time. They stack up. That's why the fastest wins usually come from visibility first.
Build item-level margin files that include freight, trade spend, deductions, broker commissions, and post-audit activity [4]. Set margin floors by channel. Track net realized price as the core revenue metric [15]. Then match each source of pressure to the right pricing, finance, or operating response.
One number makes the point well: a 1% price increase can lift operating profit by 12.3%, so small, targeted repricing moves can have an outsized effect [9].
With that kind of cadence, margin defense stops being a cleanup job and becomes part of the company’s normal operating rhythm.
Look past top-line revenue and check profit by SKU and channel. Build a gross-to-net view so you can see the actual revenue you keep after trade spend, including promotions, slotting fees, and allowances.
Then split deductions by retailer and distributor, and calculate the fully loaded contribution margin for each product. Include channel-specific costs like fulfillment and freight. That makes it much easier to see where margin is slipping - whether it’s product mix, trade spend, or input costs.
Don’t stop at gross margin. Track contribution margin too.
Gross margin is a good starting point, but it can blur what you’re actually making because it leaves out the full cost to serve. That includes trade spend, fulfillment, transaction fees, and variable marketing costs.
When you look at a fully loaded contribution margin by channel and SKU, you can see where profit is actually coming from. That gives you a much better basis for pricing, investment, and promotion decisions.
The fastest fix is a disciplined cost-takeout sprint. Done well, it can improve run-rate EBITDA within 12 weeks. The goal is simple: stop the immediate leaks by trimming SKUs, tightening trade spend controls, and improving plant-level levers.
Companies can also gain 3% to 5% in margin through modern Revenue Growth Management. The key is using SKU-level data to cut unprofitable promotions and retailer deductions. Skip across-the-board cuts. A precise cost-layer analysis works better.