Published on
June 18, 2026


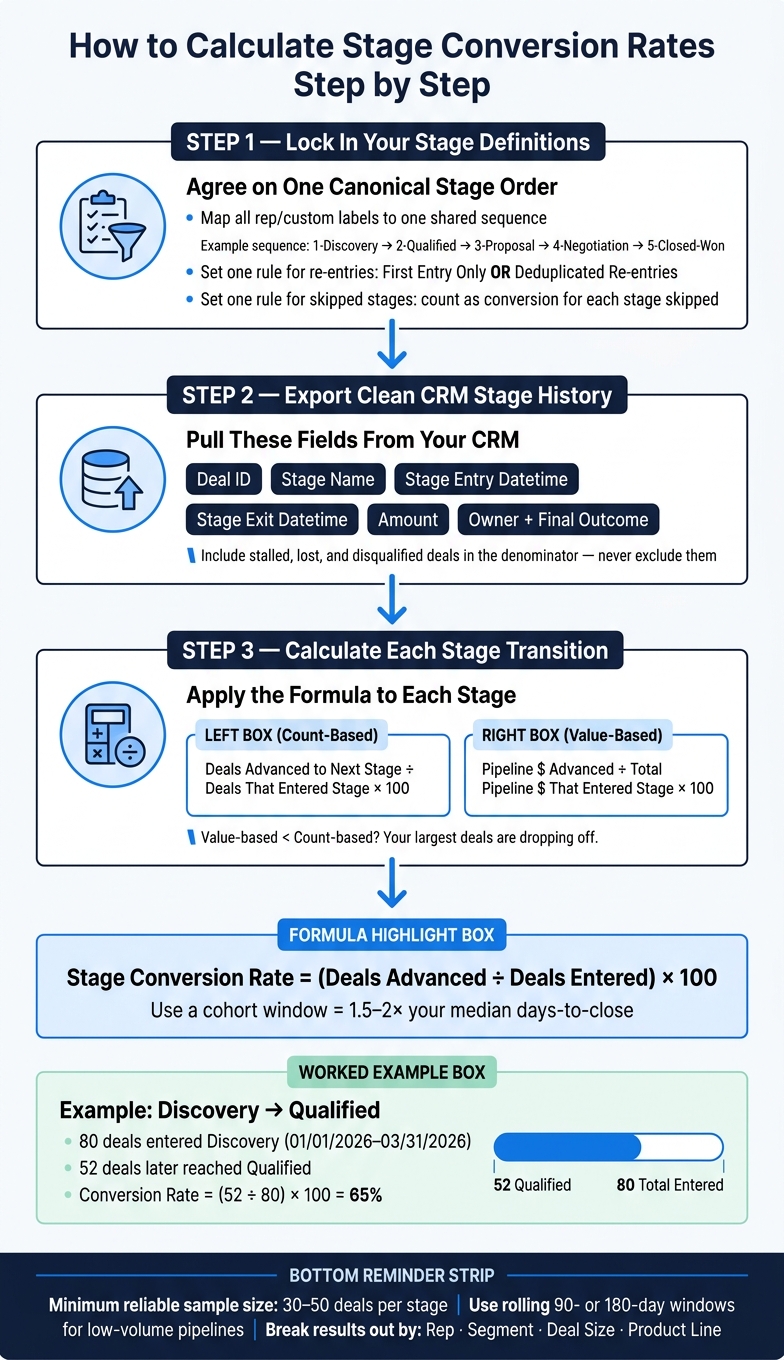
If your stage conversion math is wrong, your forecast is wrong too. I calculate stage conversion rates by using a stage-entry cohort, counting all deals that entered a stage in a set period, and then checking how many of those same deals moved to the next stage.
Here’s the short version:
A simple example: if 80 deals entered Discovery from 01/01/2026 to 03/31/2026, and 52 later reached Qualified, the conversion rate is 65%.
I also watch for two common problems: bad CRM stage history and small sample sizes. If a stage has fewer than 30 to 50 deals, I treat the result with care.
This gives me numbers I can use for forecasting, pipeline review, hiring plans, and stage-level problem spotting without guessing. Many growing businesses use fractional CFO services to build these models and ensure data accuracy.
Use this formula for count-based conversion:
Stage Conversion Rate = (Deals that advanced to the next stage ÷ Deals that entered that stage during the period) × 100
After that, you need to decide what you're measuring: deal count or deal value.
The count-based formula looks at how many deals moved forward compared with how many entered the stage. The value-based formula looks at pipeline dollars instead of raw deal volume [2].
Use value-based conversion when you want to forecast revenue or catch leakage in large deals. If value-based conversion comes in lower than count-based conversion, that usually means your biggest deals are dropping off more often than smaller ones [2].
| Formula Type | Based On | Best For | Key Trade-off |
|---|---|---|---|
| Count-based | Number of individual deals | Sales process health, rep coaching, spot bottlenecks | Can be skewed by many small deals [4] |
| Value-based | Total pipeline dollars | Revenue forecasting, executive reporting, big-deal leakage | Highly sensitive to one or two large deals dropping out [4] |
The next thing that can throw off your numbers is the time window.
Use cohort-based tracking. Take all deals that entered a given stage during a set period - say, 01/01/2026 to 03/31/2026 - and then track what share of those exact deals moved ahead [3][1]. This helps you avoid snapshot distortion from deals that are still moving through the pipeline.
A good rule of thumb: make the observation window 1.5 to 2 times your median days-to-close to cut down distortion from deals still in progress [2].
If your pipeline is noisy, smooth the data with a rolling period. A rolling 90-day or 180-day window can help reduce seasonal noise.
How to Calculate Stage Conversion Rates: Step-by-Step Formula Guide
With your stage map and formulas in place, you can now calculate each transition in a clean, consistent way.
Start by locking in one canonical stage order before you calculate anything. If your team uses custom labels or rep-specific stage names, map them to one shared sequence, such as 1-Discovery, 2-Qualified, 3-Proposal, 4-Negotiation, 5-Closed-Won [2].
Why does this matter? Because messy stage naming throws off stage-to-stage conversion rates fast. If one rep uses "Demo Scheduled" and another uses "Discovery Complete", you can end up comparing apples to oranges.
If deals can move back into an earlier stage, set one clear rule upfront: use first entry only or deduplicated re-entries [2].
Next, export the stage history from your CRM [2]. At a minimum, include these fields:
Use the deals whose stage-entry date falls inside your observation window as the denominator [2][7]. Then count how many of those deals later reached the next stage to get the numerator [2][4].
Here’s a simple example. If 80 deals entered Discovery between 01/01/2026 and 03/31/2026, and 52 later moved into Qualified, the Discovery-to-Qualified conversion rate is 65% [(52 ÷ 80) × 100] [1][3].
Once you have the base rate, split it out by segment. That’s where the story usually starts to change.
After you calculate the blended rate, break it down by segment to spot bottlenecks. A blended rate can make things look fine when one part of the pipeline is doing well and another is struggling.
For instance, Enterprise deals often convert from Opportunity to Close at about 31%, compared with 46% for SMB deals [7]. That’s a big gap, and you won’t see it if you only look at the top-line number.
Break results out by:
This kind of cut shows which teams, deal sizes, or products are pulling conversion down [1][3][5].
Bad conversion rates usually come down to a few common issues: weak cohort logic, messy re-entry rules, or CRM records with gaps. Start with the cohort math. Then clean up the CRM.
Use the stage-entry cohort as your denominator, not the current pipeline snapshot. That means you count every deal that entered the stage during the time period you’re studying. If you only look at what’s sitting in the pipeline right now, the math gets skewed fast.
The denominator should also include stalled, lost, and disqualified deals. Leave those out, and your conversion rate will look better than it is [7].
Re-entry needs one clear rule. If a deal can come back into the same stage, pick one method and stick with it: first entry only or deduplicated re-entries [1].
Skipped stages need attention too. If a deal jumps ahead, count that as a conversion for each stage it skipped [4].
Once those counting rules are locked in, look at the pipeline itself. Old records, half-filled fields, and deals sitting in the wrong stage can throw off the numbers just as much as bad formulas.
Single-quarter snapshots can swing a lot, especially with low deal volume. If a stage has fewer than 30–50 deals, the sample usually isn’t strong enough to support firm takeaways [6]. A rolling window helps smooth those swings and gives you a steadier benchmark [1][7].
It also helps to watch aging deals before they clog the pipeline. Flag late-stage deals that sit longer than 1.5–2x the median days in stage [2]. Then review those deals every week before they stall [7].
For value-based analysis, tighten the data rules in your CRM:
That way, when you compare conversion by deal value, you’re not mixing clean records with messy ones.
Once your conversion rates are clean and steady, they stop being just a reporting metric. They become a planning tool.
That matters because stage conversion rates can help you estimate near-term revenue and make smarter calls on hiring, budget, and team capacity. In short: use these rates for planning, not just dashboards.
The core math is simple. Take the number of open opportunities in each stage, multiply that by the historical close probability for that stage, and then multiply by your average deal size. Add those totals across stages, and you get a stage-weighted revenue forecast [3][2].
Sounds simple, and it is. The hard part is using the right inputs.
Use historical cohort rates, not default probabilities from your CRM. Those defaults often look neat, but they can drift away from what your pipeline is actually doing. Recalibrate your rates every quarter so the forecast stays tied to current sales behavior.
You should also discount stalled deals instead of giving them full credit in the forecast. A deal that has been sitting in the same stage too long is not the same as an active deal moving forward. Treating both the same can make the forecast look better than it should.
For planning, line up the forecast window with the decision you need to make. Use the same rolling window you used for measurement, or use a trailing 12-month view when you're planning for the year ahead.
Conversion rates are also useful for hiring and capacity planning. If the real problem sits in the middle of the funnel, adding more top-of-funnel volume or hiring more SDRs will not fix the revenue gap. It just gives you more deals that stall in the same weak stage [7]. That’s the kind of signal leaders need. The numbers can show whether the issue points to process changes or better sales enablement.
The same cohort rules that make conversion rates accurate also make forecasts worth using. Accurate stage conversion reporting starts with a few decisions made before any math happens: stable stage definitions, a stage-entry cohort denominator, one time-window rule, clean CRM data, and segment-level cuts before you trust blended results.
Use count-based conversion rates to track how many deals move from one stage to the next. This helps you spot bottlenecks and stage-specific friction fast.
Use value-based conversion rates to see whether bigger deals move through the funnel at the same pace as smaller ones. If value-based conversion lags behind count-based conversion, your largest deals may be in trouble.
For a cleaner read, track both by cohort instead of relying on point-in-time snapshots.
Your cohort window should line up with your sales cycle. A 90-day window is a common way to group opportunities by creation date or by the quarter when they entered a stage.
To avoid skew from deals still moving through the pipeline, use completed cohorts that entered a stage at least 1.5 to 2 times your median days-to-close before the snapshot date. Then track those cohorts the same way through each stage of the funnel so time lag doesn’t throw off the picture.
Calculate conversion rates by counting any opportunity that makes it to a later stage, while leaving out deals marked closed-lost.
Use the same rule every time: conversion rate = opportunities that move to any future stage ÷ total opportunities that first entered the starting stage. Clear, rule-based stage definitions help prevent distorted funnel analysis when deals skip steps or move backward.