Published on
June 25, 2026


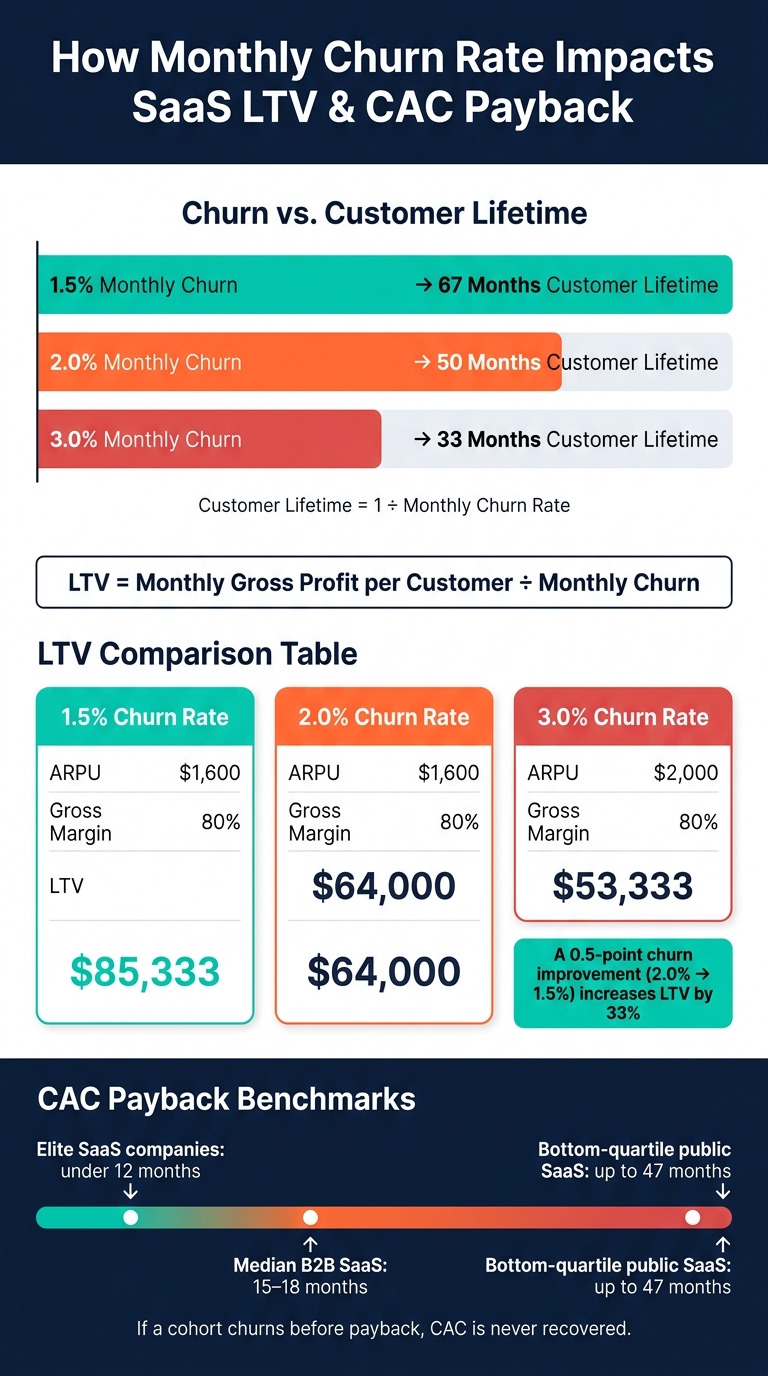
A small churn change can wreck a SaaS model. If monthly churn moves from 2.0% to 3.0%, customer life drops from about 50 months to 33 months. And if churn falls from 2.0% to 1.5%, LTV can grow by 33%.
Here’s the short version:
A simple model can look fine while older cohorts are getting worse. That’s why I’d start with retention assumptions first, then test growth plans against weaker churn cases before adding spend.
How Monthly Churn Rate Impacts SaaS LTV & CAC Payback
In a steady-state model, customer lifetime is about 1 divided by monthly churn. So if monthly churn is 2%, the average customer stays for 50 months. Push churn to 3%, and that falls to 33 months.
LTV follows the same logic:
LTV = monthly gross profit per customer ÷ monthly churn
That gross profit piece matters. Use revenue instead, and LTV gets inflated. Churn changes lifetime value because it cuts the earning window short, not just because you lose more customers. And once gross profit is set, the next question is simple: does churn leave enough time to earn back CAC?
The math gets harsh fast. Even when ARPU goes up, worse churn can still drag LTV down.
| Monthly Churn | ARPU | Gross Margin | LTV |
|---|---|---|---|
| 1.5% | $1,600 | 80% | $85,333 |
| 2.0% | $1,600 | 80% | $64,000 |
| 3.0% | $2,000 | 80% | $53,333 |
That’s the part many founders miss: higher ARPU doesn’t cancel out weaker churn. A 0.5-point drop in monthly churn - from 2% to 1.5% - increases LTV by 33% [1].
It also matters which retention number goes into the model. These metrics do different jobs:
For base LTV, use GRR before expansion. NRR can make the picture look better than it is. NRR above 100% is a strong sign, but on its own it can overstate LTV if high logo churn is sitting underneath it [2]. That same gap between headline retention and underlying churn shows up again in CAC payback.
Cohort-level payback matters because blended averages can smooth over early churn and make CAC recovery look safer than it is. CAC payback is:
fully loaded CAC divided by monthly ARPU × gross margin %
At $1,600 ARPU and 80% gross margin, each customer produces $1,280 in monthly gross profit. Median B2B SaaS CAC payback usually lands between 15 and 18 months [1][2].
The issue isn’t the formula. The issue is the assumption hiding inside it: that the customer sticks around long enough to hit the payback date. If a cohort churns before payback, CAC is never recovered.
The spread can be huge. Top-quartile public SaaS companies post a median payback of 16 months, while bottom-quartile companies stretch to 47 months [3]. That’s why churn timing at the cohort level matters so much. Those retention assumptions can’t stop at payback math; they also need to feed into margin modeling.
When churn cuts customer lifetime short, it also cuts the margin dollars you need to pay back CAC. That’s the part people often miss. Churn doesn’t only reduce revenue. It also makes each retained dollar more expensive.
Gross margin is revenue left after direct costs. Contribution margin is what’s left after variable costs, and that’s the pool used to cover fixed overhead.
This matters because onboarding and implementation costs hit early and need time to be earned back. When a customer leaves too soon, that payback window shrinks. At the same time, some cloud costs don’t fall much even when revenue does [1][2]. So the big issue isn’t just the margin benchmark on paper. It’s whether that margin can hold up as churn moves through the business.
Gross margin also amplifies churn across the whole model. The median gross margin for private SaaS companies is 77% [1][3]. And if gross margin drops below 60%, that usually points to a cost structure problem, not a pricing problem [2].
A flat company-wide margin can look calm while things are getting worse underneath. That’s why the next step is to break churn out by customer segment instead of stopping at the blended average.
For example, a high-margin enterprise segment can mask a weaker SMB segment with high churn. On the surface, the blended margin may stay flat. Underneath, the weaker segment keeps getting more expensive and harder to keep [4][3]. That’s exactly why churn-adjusted margin analysis matters. Blended figures won’t show which customers are draining time and money.
Higher-churn segments often need more support for every dollar they keep. They use more support hours, need repeat re-onboarding, and create more tickets per retained dollar [1][2]. If all of those costs get rolled into one company-wide margin number, you lose sight of how expensive those accounts are.
A cleaner setup looks like this:
When those costs get mixed together, the true margin floor gets buried. Renewal and expansion work belong in sales and marketing, not COGS.
There’s another tell here. If customer success headcount is growing faster than ARR, retention costs are rising faster than revenue. That pattern should show up right away in cohort-level unit economics.
Once churn shows up in the margin section, it also needs to drive the rest of the model. Don't treat churn like a fixed number sitting off to the side. Treat it like a live input. In a connected SaaS model, a change in churn should flow through customer lifetime, LTV, CAC payback, margin, and cash burn without manual fixes. Build the model from the top down so that when churn moves, those outputs move with it. And that starts with cohort-level retention, not blended monthly averages.
Blended ARPA can blur what is happening inside the business. One cohort may recover CAC cleanly, while another may never get there. If you track churn and ARPA by cohort, the model can show those differences instead of hiding them inside an average.
Once the mechanics are set, pressure-test the growth plan. Run base, downside, and stress churn cases side by side while keeping bookings targets the same across all three. That makes the impact easier to see. Different churn assumptions should change runway, hiring pace, and booking capacity.
A small shift can have a big effect. A half-point improvement in monthly churn - from 2% to 1.5% - can increase LTV by 33% [1]. That's why churn belongs at the center of the model, not at the edge.
Also, model churn as a curve instead of a flat line. Retention often drops the most in months 1–3 and then again at renewal. Because of that, cohort curves tend to give a more useful read than a single monthly average.
If the model depends on clean cohort data and clean margin inputs, the next weak spot is usually data accuracy. Phoenix Strategy Group helps growth-stage companies connect churn, LTV, CAC payback, margin, and cash flow in one FP&A model. That matters when cohort data and headline payback numbers tell two different stories.
The benchmark context matters too. The median CAC payback period for B2B SaaS is currently 15 to 18 months, while elite companies target under 12 months [1][2]. If your model shows payback inside that range but your cohort data doesn't back it up, there's a gap in the model worth finding before you scale.
Once churn is in the model, use it to pressure-test the growth plan under weaker retention. If the plan only works when churn stays low, it doesn’t say much about growth. It says retention is doing all the heavy lifting.
That matters when you’re weighing new sales hires, a higher CAC, or a pricing change. If those moves only make sense when churn stays at or below today’s level, then the limit isn’t sales execution. It’s retention.
NRR can still look solid while GRR starts to slip, because expansion revenue can cover up customer loss. So when you test the plan, look at GRR directly, not just NRR.
Use these checks to compare forecast assumptions with actual retention.
| Metric | Why It Matters |
|---|---|
| Cohort retention at months 3, 12, 24 | Whether early-stage churn is improving or renewal friction is growing |
| Net Revenue Retention (NRR) | Total retention health including expansions and contractions |
| Gross Revenue Retention (GRR) | Core retention without expansion masking losses |
| LTV by cohort | Whether newer customers are more or less profitable than older ones |
| CAC payback by acquisition month | How long it takes to recover fully loaded acquisition costs |
| Gross margin trend | Whether direct delivery costs are creeping up and compressing unit economics |
| Contribution margin trend | Whether each customer is actually profitable after CS and support costs |
| Cash runway | Whether payback periods are outpacing available cash runway |
If those metrics start to drift, update the growth plan before you add more spend. The big warning sign is simple: new customers are coming in faster, but unit economics aren’t getting better.
Churn affects every part of unit economics. Start with retention assumptions, then build hiring, pricing, and capital plans from there.
If the numbers only work in the best-case churn scenario, that’s the weak spot to fix before scaling anything else.
Calculate churn-adjusted LTV by multiplying ARPU by gross margin %, then dividing by monthly churn rate:
LTV = (ARPU × Gross Margin %) / Monthly Churn Rate
Since churn sits in the denominator, even small shifts can have a big effect on LTV. That’s why this formula deserves a close look. A move from 5% monthly churn to 4%, for example, can change the output more than many teams expect.
If you want a model that reflects what customers actually do, use cohort-based retention data instead of static averages. Static averages are simple, but they can smooth over patterns that matter, like early drop-off or stronger retention in later months.
Both matter, and you should track both.
Logo churn shows the share of customers who cancel. It helps you spot retention problems and see whether your product is a good fit for the people you’re selling to.
Revenue churn shows the dollar impact of cancellations and downgrades. That matters because losing a high-paying customer hits a lot harder than losing a smaller account.
If you only look at logo churn, you can miss the bigger picture. It may make customer lifetime value look lower than it is, especially when net revenue retention is strong.
Don’t stop at top-line numbers. They can smooth over patterns that matter.
Use cohort analysis by sign-up date to spot when churn peaks. If churn is high in the first 30 to 90 days, that usually points to onboarding or activation problems. In plain terms, people are signing up but not getting to value fast enough.
It also helps to compare churn across segments like:
That makes it easier to tell whether you’re dealing with a product problem or a shift in customer mix. And once you know which it is, you can put time and budget where they’ll do the most good.