Published on
June 25, 2026


A raw control premium can overstate value fast. In many U.S. deals, observed premiums fall around 20% to 40%, and some reach 50%. But those numbers often include synergy, auction heat, and debt effects that do not belong in a private company stand-alone valuation.
Here’s the short version: when I use a control premium, I first ask what part of the deal price would still exist for a generic market participant. Then I remove buyer-only upside, process noise, and capital structure distortion. Last, I check that I’m not adding control twice through a DCF, normalized earnings, or precedent transaction multiples.
If you want a clean framework, this is the path:
A simple rule helps: if the cash flow model already includes owner pay cleanup, expense normalization, refinancing, or other control changes, I do not stack another control premium on top.
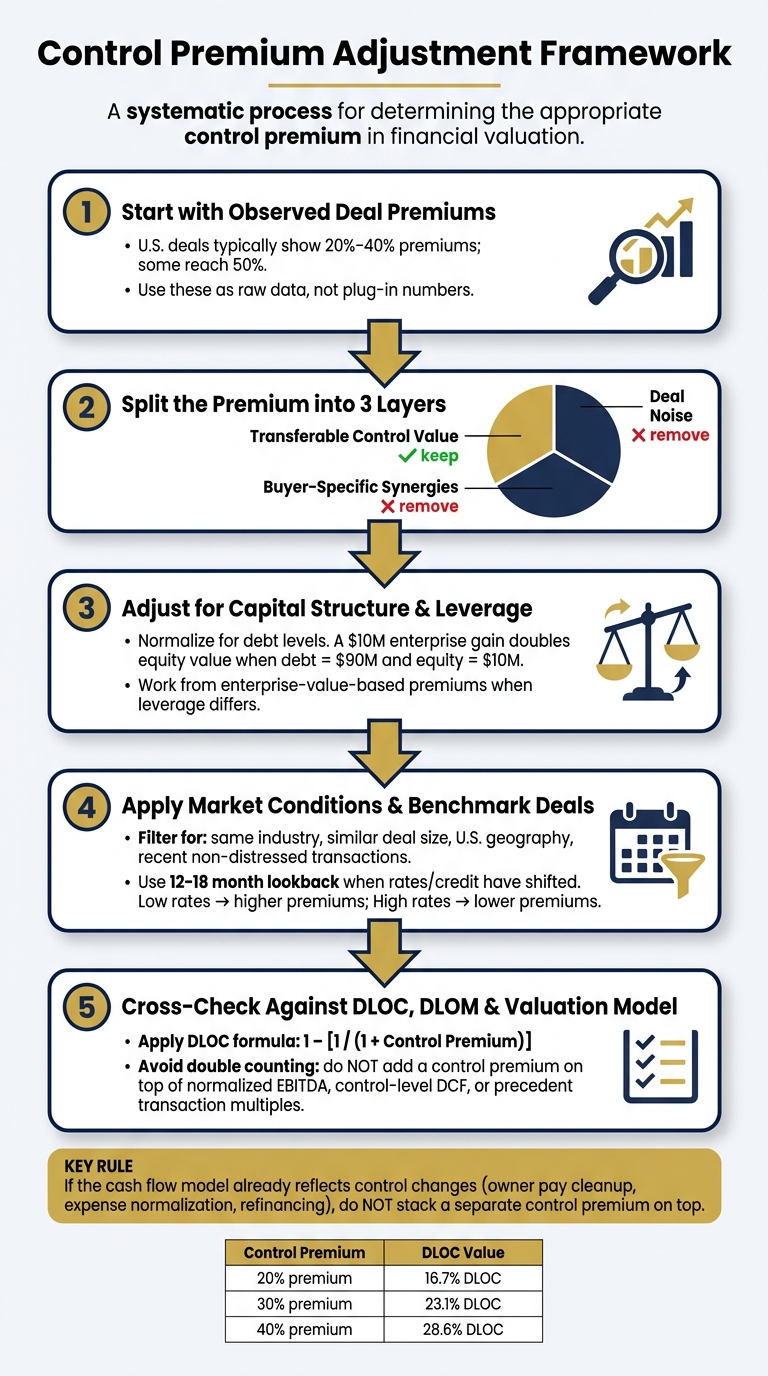
Control Premium Adjustment Framework: 5 Steps to a Defensible Valuation
| Item | What I keep | What I remove |
|---|---|---|
| Transferable control value | Changes a market participant could make | - |
| Buyer synergies | - | Cost savings, revenue upside, tax items tied to one buyer |
| Deal process effects | - | Auctions, hostile bids, distress pressure |
| Capital structure effects | Enterprise-level view, if needed | Equity premium distortion from unmatched debt |
| Level of value adjustments | DLOC and DLOM used in the right order | Any duplicate control adjustment |
Bottom line: I don’t treat a published premium as a plug-in number. I treat it as raw data that needs filtering before it fits a private company valuation.
Every acquisition premium has three separate layers: transferable control value, buyer-specific synergies, and deal noise. Your job is to split them apart.
Here’s the core idea: what part of the premium would still be there if the company were sold to a generic buyer?
A benchmark premium includes stand-alone value, transferable control value, buyer-specific synergies, and deal noise [2][6]. Transferable control value is the value a capable market participant could create through financial control, like improving the capital structure or stripping out owner-related expenses that don't belong in normal operations [3]. That piece belongs in your analysis. Buyer-specific synergies do not.
Not all synergies deserve the same weight.
Cost synergies are usually easier to underwrite than revenue synergies [2]. If a buyer says it can cut duplicate overhead, merge systems, or reduce headcount, that claim is often easier to test. Revenue synergies are a different story. Cross-selling, channel expansion, and pricing gains sound good, but they carry more uncertainty and should be discounted more hard [2].
Tax benefits can matter too, but only for the buyer that can use them [1].
Buyers also don't pay dollar-for-dollar for projected synergy. They pay for a discounted share of expected synergy after factoring in timing, integration risk, and deal costs [2][6]. And those costs can add up fast:
Those items can eat into a meaningful share of the projected upside [6].
Buyer type matters a lot.
Strategic buyers usually pay more because they can justify synergies. Financial buyers usually stay closer to stand-alone value, which makes them the better market-participant reference under ASC 820 [2][6].
That distinction matters because a high premium from a strategic acquirer may say more about that buyer than about the asset itself.
Some premiums show up because of the sale process, not because the business is worth more.
Auction pressure is the clearest case. When several motivated bidders are competing, the seller can pull out more of the buyer's internal synergy value. That can push multiples up by one to two turns versus a proprietary deal [7][1]. But that bump has nothing to do with what the business is worth to a generic buyer.
So strip out process-driven premiums such as auction pressure, distressed sales, and hostile bidding [1][4]. Use only the factors that would still exist in a generic sale of the subject company.
Once you've cleaned the premium by removing synergies and deal noise, the next step is to adjust for capital structure and debt.
Once you strip out synergies and deal noise, the next thing to check is leverage. Capital structure can change the premium you see in a big way, so before you apply any figure, compare the debt profile of the subject company with the debt profile in guideline deals.
Control value includes the buyer’s ability to refinance debt, shift capital allocation, or pay for acquisitions. Because of that, leverage can either amplify the premium or squeeze it down.
Here’s the simple math: a $10 million gain in enterprise value doubles equity value when debt is $90 million and equity is $10 million. That same $10 million gain leads to a much smaller equity premium in a company with light leverage. So if two deals have very different debt loads, their equity-level premiums are not clean apples-to-apples comparisons.
When guideline deals use different leverage, it usually makes more sense to work from enterprise-value-based premiums. Then look at the debt load, interest coverage, and refinancing risk to decide whether control should justify a higher or lower premium.
If the subject company is close to covenant pressure or has refinancing coming up soon, the premium may be lower because the buyer has less room to maneuver [5][10].
This part matters more than many people think. Keep the WACC, cash flow adjustments, and premium assumption on the same capital structure basis. If you mix a control-level DCF with a separate control premium on top, you’re counting the same thing twice [5][9].
After you normalize for leverage, compare the result with current market conditions and recent premium studies.
Once your capital structure is normalized, the next job is simple in theory but tricky in practice: separate what the data does show from what it doesn't. Published control premium studies can help, but they are starting points, not plug-and-play answers. One of the most common errors in private company valuation is taking a headline median at face value without looking at how that number was built.
Datasets from sources like Capital IQ and Bloomberg calculate premiums by comparing the acquisition offer price with the target's unaffected stock price [12][11]. In most cases, the baseline is the stock price from 4 weeks before the deal announcement, which helps screen out noise from leaks and speculation [12].
That sounds clean. But the published medians can still blur very different kinds of transactions together. They often include clean deals alongside hostile, distressed, and highly strategic acquisitions [11]. So if you rely on the median alone, you can end up with a number that looks precise but says less than you think.
That's why many analysts start with the median, then look at the interquartile range to see where the bulk of transactions landed [1]. It gives you a better feel for the middle of the market instead of just one headline figure. And it's worth keeping in mind that observed premiums reflect actual control transactions, not some pure textbook version of control value [3].
There's another trap here. Many published premiums already reflect buyer-specific synergies. If you apply one of those premiums on top of a DCF that already bakes in synergy-heavy assumptions, you're counting the same value twice [3].
Deal terms don't happen in a vacuum. The market backdrop at the time of the transaction can move observed premiums by a lot. When interest rates are higher and credit is tighter, buyers usually have less leverage and less buying power, which pushes observed premiums down [1].
| Market Condition | Effect on Observed Premiums |
|---|---|
| Low interest rates / loose credit | Higher premiums |
| High interest rates / tight credit | Lower premiums |
This is why the best benchmark is not the broadest one. It's the set of deals that looks most like the subject company's buyer pool and financing setting.
Sector scarcity can also push premiums up. But broad averages can still overstate value when the subject company doesn't have that same scarcity appeal [12].
Broad averages are a place to begin, not a finish line. The goal is to build a narrower set of deals that actually lines up with the subject company. In practice, that usually means filtering for:
You also want the benchmark set to match the likely buyer type. Strategic acquirers often support higher premiums than financial sponsors [13].
Timing matters too. A 24–36 month lookback can work in stable industries. But if interest rates or credit conditions have shifted in a big way, it's smarter to tighten that window to 12–18 months [1]. And when you're weighing the data, give more weight to the newest and closest matches rather than older deals that fit less well.
The adjusted premium still needs a last pass against DLOC, DLOM, and the full valuation model. The point is to make sure the premium fits the rest of the analysis and doesn't slip in another layer of double counting.
Once you've stripped out synergies, leverage effects, and market noise, the next step is simple: check what level of value the adjusted premium points to. That's the whole point here. You want to make sure the premium hasn't already been baked into the valuation somewhere else.
Control premiums and DLOC move in opposite directions along the control spectrum. A control premium moves value from a minority level up to a control level. A DLOC brings it back down. The formula is DLOC = 1 – [1 / (1 + Control Premium)] [5][12].
Here’s how that works at common premium levels [5][12].
| Control Premium | Implied DLOC |
|---|---|
| 10% | 9.1% |
| 20% | 16.7% |
| 25% | 20.0% |
| 30% | 23.1% |
| 40% | 28.6% |
| 50% | 33.3% |
DLOM should stay separate. It deals with illiquidity, not control.
A lot of valuation mistakes happen because people stack adjustments that already reflect the same thing. The usual trouble spots are:
The valuation method should line up with the premium. If it doesn't, something's off.
For example, if the DCF already includes control-level changes - like normalized owner pay, removed discretionary expenses, or a better capital structure - you shouldn't layer on a separate control premium after that [5][10]. That's double counting, plain and simple.
The same logic applies to market data. Public trading multiples reflect marketable minority value, while precedent transaction multiples already reflect control value [5][12]. So if you're trying to reach a private minority value, move from the source level of value to the target level in the right order: apply DLOC first, then DLOM if marketability is still missing [5][8].
Under ASC 820, buyer-specific synergies have to come out so the analysis reflects a market participant view. That means the adjusted premium should reflect financial control, not strategic or investment value [10][14]. One helpful gut check is the synergy breakeven test: if the annual synergies needed to support the premium are bigger than what the business could reasonably improve through operations, the premium is likely too high [12].
A sound control premium adjustment follows a clear path. Start with observed deal data. Separate pure control value from buyer-specific synergies. Strip out deal features that don't belong in a private company valuation. Then test the result against DLOC, DLOM, and the rest of the valuation so the same value isn't counted twice.
What survives that process should match the level of value already built into the valuation method. That's what makes the adjustment defensible.
Use a control premium when you're valuing a controlling interest - usually 50% or more. The premium reflects the extra economic upside and decision-making power that come with control.
It also helps close the gap when you rely on minority-stake market prices, like public trading comps, to value a private company. On the flip side, if you use the guideline M&A method to value a noncontrolling interest, adjust the controlling value downward to account for the lack of control.
Separate the part of the purchase price that comes from buyer-specific gains, not just control rights. Then subtract that synergy premium component from the total acquisition premium.
In practice, this usually takes detailed financial modeling. A discounted cash flow analysis is often used to estimate expected cost savings or added revenue from the deal. The basic formula is: Adjusted Control Premium = Acquisition Premium - Synergy Premium Component.
Make sure your valuation method doesn’t already bake in the benefits of control. If your discounted cash flow model assumes changes to management, strategy, capital structure, or operations, adding a separate control premium would mean double counting.
You should also check whether your multiples already reflect control pricing or minority pricing. And keep synergies separate from control value. They’re not the same thing, so they shouldn’t be lumped together.