Published on
May 18, 2026


Want to boost your consumer goods business profits? Start with COGS (Cost of Goods Sold). Lowering production costs directly increases your margins, which fuels growth areas like marketing, hiring, and scaling. Here’s what you need to know:
Bottom Line: Managing COGS effectively isn’t just about cutting costs - it’s about understanding where your money goes and making smarter decisions to protect and grow your margins.
COGS Optimization: Key Metrics, Benchmarks & Cost-Saving Strategies
Getting cost reduction right starts with precise measurements. Unfortunately, many brands either skip this step or don’t execute it thoroughly, leading to decisions based on incomplete or inaccurate data.
COGS (Cost of Goods Sold) for consumer goods involves more than just raw material costs. It includes all direct expenses tied to producing and delivering a product. These components cover:
The IRS provides clear guidelines for packaging costs. Packaging that’s integral to the product (like a bottle for a beverage) is part of COGS, while other packaging is classified as shipping or selling expenses.
"Containers and packages that are an integral part of the product manufactured are a part of your cost of goods sold. If they are not an integral part of the manufactured product, their costs are shipping or selling expenses." - IRS Definition via Lisa Moise, SPRCHRGR [5]
Sales channels also influence COGS. For instance, direct-to-consumer (DTC) orders include additional costs like 3PL pick-and-pack fees and postage. Wholesale orders, on the other hand, add freight to distribution centers and brokerage fees [4]. Using a single blended COGS figure across multiple channels can distort margin insights, making it harder to see where profits are being gained or lost.
Once you’ve defined your cost components, the next step is determining the right inventory valuation method.
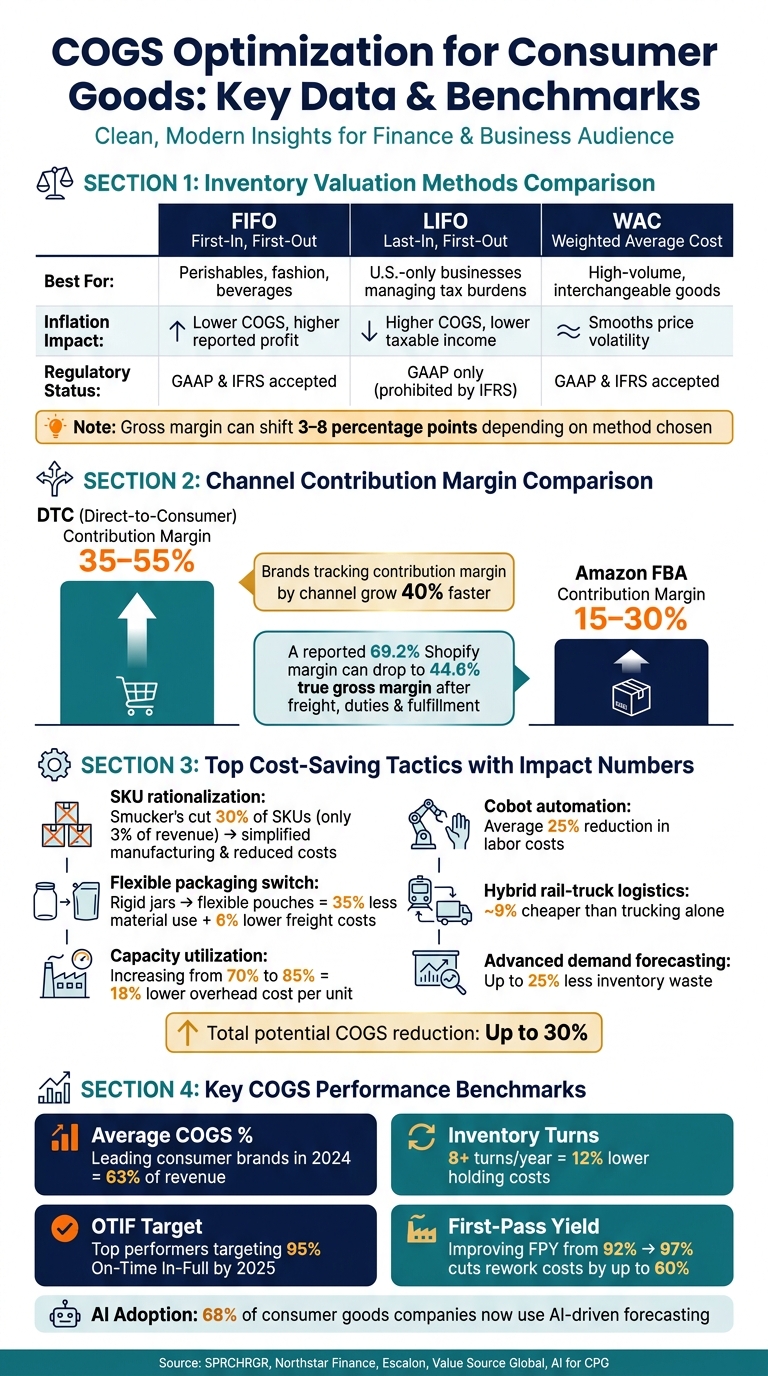
How you value inventory has a direct impact on your reported gross margin, sometimes shifting it by 3 to 8 percentage points during periods of fluctuating costs [6]. The three main inventory valuation methods for consumer goods businesses are:
| Method | Best For | Inflation Impact | Regulatory Status |
|---|---|---|---|
| FIFO | Perishables, fashion, beverages | Lower COGS, higher reported profit | GAAP & IFRS accepted |
| LIFO | U.S.-only businesses managing tax burdens | Higher COGS, lower taxable income | GAAP only (prohibited by IFRS) |
| WAC | High-volume, interchangeable goods | Smooths price volatility | GAAP & IFRS accepted |
For most consumer goods brands - especially those in food, beverage, or personal care - FIFO is often the best fit. It aligns with the actual flow of inventory and is widely accepted under both GAAP and IFRS [6][7]. LIFO, while helpful for managing taxes during inflation, is only allowed under GAAP and is prohibited by IFRS, making it unsuitable for businesses with international operations or those seeking institutional capital [9]. WAC is a practical option for brands managing a large number of SKUs, where tracking individual cost layers can become overwhelming [7].
As Shannon O'Neill of Escalon points out:
"A poorly chosen costing method can lead to inventory being overvalued or undervalued on the balance sheet, which can mislead investors and affect financial ratios." [7]
No matter which method you choose, consistency is critical. Switching valuation methods mid-stream can complicate financial reporting and often requires formal disclosure in your statements [6][8].
Once you’ve nailed down your cost components and valuation method, the next step is building a system to track COGS accurately at the unit level. For every SKU, map out each cost component - ingredients, packaging, labor, freight-in, and co-packer fees - and convert batch costs into per-unit figures [4]. This granular approach helps you pinpoint product profitability and spot areas where margins are shrinking.
Your accounting and inventory systems should break down COGS by SKU, product line, and sales channel, rather than lumping everything into a single blended figure [10]. This is especially important for brands operating across both DTC and wholesale channels, where margin structures differ. Additionally, you’ll need a process to update your COGS model whenever there are shifts in supplier pricing, freight rates, or production volumes [4]. Keeping your cost models static can lead to missed opportunities and unexpected hits to profitability.
Laying this solid COGS foundation is essential for identifying cost-saving opportunities and improving margins, paving the way for smarter, more strategic decisions.
A precise understanding of COGS (Cost of Goods Sold) is just the starting point. The real value comes from breaking down these numbers to uncover what’s driving - or draining - your margins at the SKU and channel levels. Raw figures alone won’t cut it; the analysis is what exposes the hidden opportunities and risks.
Blended margins can be misleading. By analyzing COGS at the SKU and channel level, you can uncover the real profit drivers. In fact, SKU-level reviews often reveal that 20% to 30% of a product catalog is unprofitable once every cost layer is accounted for [3].
Different channels, like DTC (Direct-to-Consumer) and wholesale, come with unique cost structures. A margin waterfall analysis - tracking how revenue diminishes from gross sales to the final margin after factoring in trade spend, freight, 3PL fees, spoilage, and inventory carrying costs - makes these distinctions clear. For example, a Shopify-reported margin of 69.2% can drop to a true gross margin of 44.6% once inbound freight, duties, and fulfillment costs are included [3].
"The gap between perceived margin and actual margin is the difference between a brand that scales profitably and one that scales itself into a cash crisis." - Northstar Finance [3]
Returns are another often-overlooked expense. Costs like shipping, inspection, and restocking need to be distributed across all units sold, not treated as isolated incidents. For apparel and footwear brands, where return rates typically range from 25% to 40%, ignoring these costs can lead to a distorted view of profitability [3].
Breaking down these costs by product and channel lays the groundwork for a deeper look at contribution margins and unit economics.
Gross margin is just the beginning. Contribution margin - calculated as revenue minus all variable costs, including COGS, fulfillment, transaction fees, and variable marketing - provides a clearer picture of a product’s financial viability.
Brands that track contribution margin by channel grow 40% faster than those relying on blended gross margin metrics [11]. The differences between channels are striking: DTC channels often achieve contribution margins of 35–55%, while Amazon FBA typically falls between 15–30% once referral fees, FBA costs, and advertising are deducted [11]. Jason Wong, an e-commerce CFO and advisor, highlights this contrast:
"I see brands celebrating $10M in Amazon revenue at 8% net margin while their $3M DTC business runs at 35% margin. They pour resources into Amazon because it's 'bigger,' but the DTC channel generates more profit dollars with a fraction of the complexity." [11]
To make better decisions, analyze each SKU’s cost components to determine its exact per-unit cost. Use this data to calculate breakeven prices and establish a minimum acceptable contribution margin. Products or channels falling below this threshold should be restructured or phased out.
Once unit economics are clearly defined, the next step is identifying the cost components that have the biggest influence on margins.
With SKU-level contribution margin data in hand, rank SKUs by contribution margin percentage and total contribution dollars. Keep in mind that high-margin, low-volume items might matter less than moderate-margin, high-volume products.
From there, use variance analysis to monitor changes in material costs, freight rates, supplier fees, and spoilage. Freight costs, for example, can vary significantly depending on packaging choices. Glass bottles might carry a 14% freight cost compared to just 4% for plastic due to differences in weight and volume [12]. Inventory carrying costs add another layer, often running 20% to 35% of inventory value annually [12], which can quickly escalate for slow-moving items.
Spoilage and obsolescence are critical areas to watch. For fast-moving SKUs, spoilage might account for just 1.2% of net sales. But for slow-moving refrigerated products, that figure can spike to 18% [12]. Identifying and addressing these outliers at the product or channel level often leads to the quickest margin improvements, paving the way for the cost reduction strategies discussed in the next section.
Lowering your Cost of Goods Sold (COGS) starts with identifying your biggest cost drivers and finding ways to cut them without compromising product quality. This process involves rethinking product design, improving sourcing strategies, and streamlining manufacturing and logistics. These approaches work together to reduce costs and improve margins.
One quick way to reduce costs is by examining your product design and packaging. Take a close look at your SKUs to ensure each one contributes to profitability. For example, in 2021, Smucker's cut 30% of its SKUs, which only accounted for 3% of total revenue [13]. This move not only simplified manufacturing but also reduced inventory costs and procurement complexity.
Another effective tactic is value engineering. This involves rethinking materials and formulations while maintaining the customer experience. For instance, switching from rigid jars to flexible pouches can reduce material use by 35% and lower freight costs by 6% [16]. Additionally, standardizing ingredients across products can help consolidate suppliers, often leading to volume discounts.
"COGS optimization isn't about slashing costs indiscriminately. It's about systematically identifying and eliminating waste, improving efficiency, and making smarter sourcing decisions." - Eric Pham, Founder & CEO, Rework [15]
Once your product design is optimized, the next step is to focus on improving supplier relationships.
When evaluating suppliers, consider total cost of ownership (TCO), which includes factors like payment terms, defect rates, lead times, and freight costs. A supplier with a lower unit price but slow lead times could force you into costly expedited shipping, negating any savings.
Consolidating your vendor base can help you secure better pricing, simplify quality control, and increase order volumes. For companies sourcing internationally, regionalization is becoming more popular - 45% of consumer goods brands now source at least half of their raw materials regionally to reduce freight complexity [16]. However, when global sourcing is necessary, shifting production to lower-cost regions can make a big difference. For example, moving manufacturing from China to Cambodia can lower total landed costs by up to 20% without sacrificing quality [14]. Even a modest 3–5% reduction in material costs can lead to meaningful COGS savings [15].
"Meaningful cost reduction doesn't come from squeezing suppliers or taking shortcuts. It comes from a strategic, long-term approach that balances cost, quality, delivery, and risk mitigation." - Value Source Global [14]
On the production side, lean manufacturing principles, such as the 5S framework (Sort, Set in order, Shine, Standardize, Sustain), can help eliminate waste, reduce changeover times, and standardize processes. For example, increasing capacity utilization from 70% to 85% can lower overhead costs per unit by 18% [15]. Additionally, automation is becoming more prevalent. Using collaborative robots ("cobots") for repetitive tasks has helped consumer goods manufacturers cut labor costs by an average of 25% [16].
In logistics, cost-saving measures include optimizing container loads, switching to hybrid rail-to-truck routes (which are about 9% cheaper than trucking alone [16]), and using smart routing software to improve distribution efficiency. Advanced forecasting models can also reduce inventory waste by up to 25% [16], which means fewer markdowns, less spoilage, and lower carrying costs. Together, these manufacturing and logistics strategies can cut total COGS by as much as 30% [15].
Cutting costs is one thing, but keeping those savings intact requires accountability and forward-thinking strategies. The brands that maintain improved margins focus on three key areas: clear ownership, consistent tracking, and proactive planning.
COGS (Cost of Goods Sold) affects multiple departments, which often leads to unclear ownership - an expensive oversight. To avoid this, assign specific cost categories to designated leaders and establish regular cross-functional reviews.
| Governance Role | Primary Responsibility |
|---|---|
| Finance | Budget control, margin monitoring, and financial modeling |
| Sourcing/Purchasing | Vendor negotiations, volume discounts, supplier consolidation |
| Product Development | Cost-conscious design, material selection, packaging tweaks |
| Supply Chain/Logistics | Managing landed costs, freight efficiency, OTIF tracking |
| Operations/Manufacturing | Boosting labor productivity, cutting waste, saving energy |
| Data Science/Analytics | Forecasting, scenario modeling, and KPI dashboards |
The key is to break down overall COGS reduction goals into smaller, actionable targets - like materials, labor, or overhead - so every leader knows their role. Monthly reviews work better than quarterly ones, as they allow teams to address issues before they escalate.
"The manufacturers who excel at COGS optimization make it a continuous discipline, not a one-time crisis response." - Eric Pham, Founder & CEO, Rework [15]
This structured accountability, combined with ongoing metric tracking, ensures long-term success.
Measurement is critical - if you don’t track it, you can’t improve it. The most impactful COGS metrics fall into four main categories: profitability, inventory, production, and logistics.
| Metric Category | Key KPIs | Impact |
|---|---|---|
| Profitability | Gross margin, COGS % of revenue | Monitors production efficiency and pricing health [1][15] |
| Inventory | Inventory turnover, shrinkage | Evaluates stock efficiency and waste [1][16] |
| Production | First-Pass Yield (FPY), labor productivity | Identifies inefficiencies in manufacturing [15] |
| Logistics | Landed cost per unit, OTIF rate | Tracks the full cost of getting products to warehouses [2][16] |
Some benchmarks to keep in mind: leading consumer brands in 2024 reported an average COGS percentage of 63% [16]. Companies with eight or more inventory turns per year saw 12% lower holding costs [16], and top performers are aiming for a 95% On-Time In-Full (OTIF) delivery rate by 2025 [16]. For example, improving First-Pass Yield from 92% to 97% can slash rework costs by up to 60% [15].
Real-time ERP dashboards are invaluable, offering Finance, Sourcing, and Operations teams a shared view of cost performance. Today, 68% of supply chain teams use self-service BI tools like Tableau (around $70 per user per month) to analyze cost drivers on the spot [16].
Rigid budgets often fail when unexpected events - like commodity price hikes or supplier delays - occur. Scenario planning helps build resilience by simulating "what-if" scenarios, such as a sudden rise in raw material costs or shipping disruptions.
The best forecasting models combine historical sales data with external factors like commodity trends and supplier capacity. Sixty-eight percent of consumer goods companies now rely on AI-driven insights instead of traditional averages [16]. Businesses using advanced forecasting have reported up to 25% less inventory waste [16]. For instance, FreshWave Beauty implemented AI-driven demand planning in early 2025, avoiding $250,000 in surplus inventory and cutting production costs by 8% during a year-long pilot [16].
"If you treat cost control like a one-off project, you'll bounce from crisis to crisis. Instead, you need a structured approach that balances expense reduction with strategic reinvestment." - AI for CPG [16]
For businesses seeking extra support, services like Phoenix Strategy Group’s FP&A and fractional CFO offerings can integrate COGS assumptions directly into financial models. This enables leadership to see, in real time, how changes in sourcing or packaging affect gross margins and growth projections.
COGS is a direct reflection of how well a business manages its design, sourcing, and overall operations. As Centric Software explains:
"The most successful companies treat cost of goods sold not as a static line item, but as a dynamic system to monitor, model and continuously improve." [2]
Brands that successfully protect and grow their margins approach cost management as an ongoing commitment rather than a one-time adjustment. That means designing products with cost efficiency in mind, fostering accountability across teams, tracking critical metrics, and using scenario planning to handle challenges like rising raw material prices or higher fulfillment costs. This level of discipline helps build a strong organizational framework, transforming cost reduction from a short-term achievement into a long-term edge across finance, sourcing, product development, and operations.
COGS, or Cost of Goods Sold, refers to the direct costs involved in producing or purchasing products. This includes things like raw materials, direct labor, and manufacturing overhead. On the other hand, operating expenses account for indirect costs such as selling, general, and administrative expenses. Knowing the difference between these two categories is key for businesses to evaluate profitability and keep expenses under control.
Choosing an inventory costing method - FIFO, LIFO, or weighted average - depends on how you want to value inventory, manage financial reporting, and align with your business objectives.
Each method has its advantages, so the right choice depends on your financial strategy and market conditions.
Begin by prioritizing strategic negotiation and fostering collaboration with suppliers. The key lies in building strong, mutually beneficial relationships with your suppliers. When both parties work together towards shared goals, it often leads to cost reductions and improved efficiency.
This approach can quickly boost profit margins by fine-tuning procurement processes and cutting down on supply chain expenses. By aligning interests and maintaining open communication, businesses can unlock opportunities for smoother operations and better financial outcomes.