Published on
May 18, 2026

Want to understand your CAC for content marketing? Here’s a quick breakdown: Customer Acquisition Cost (CAC) measures what it costs to gain a paying customer. For content marketing, this includes all expenses like salaries, tools, freelancer fees, and promotions. Unlike paid ads, content has long-term value - think blog posts that keep generating leads years after they’re published.
Key points to know:
Why this matters: Without accurate CAC data, you risk overspending on underperforming channels. Measure correctly, and you can optimize your budget, lower costs, and improve returns.
Let’s dive into how to calculate CAC step-by-step.
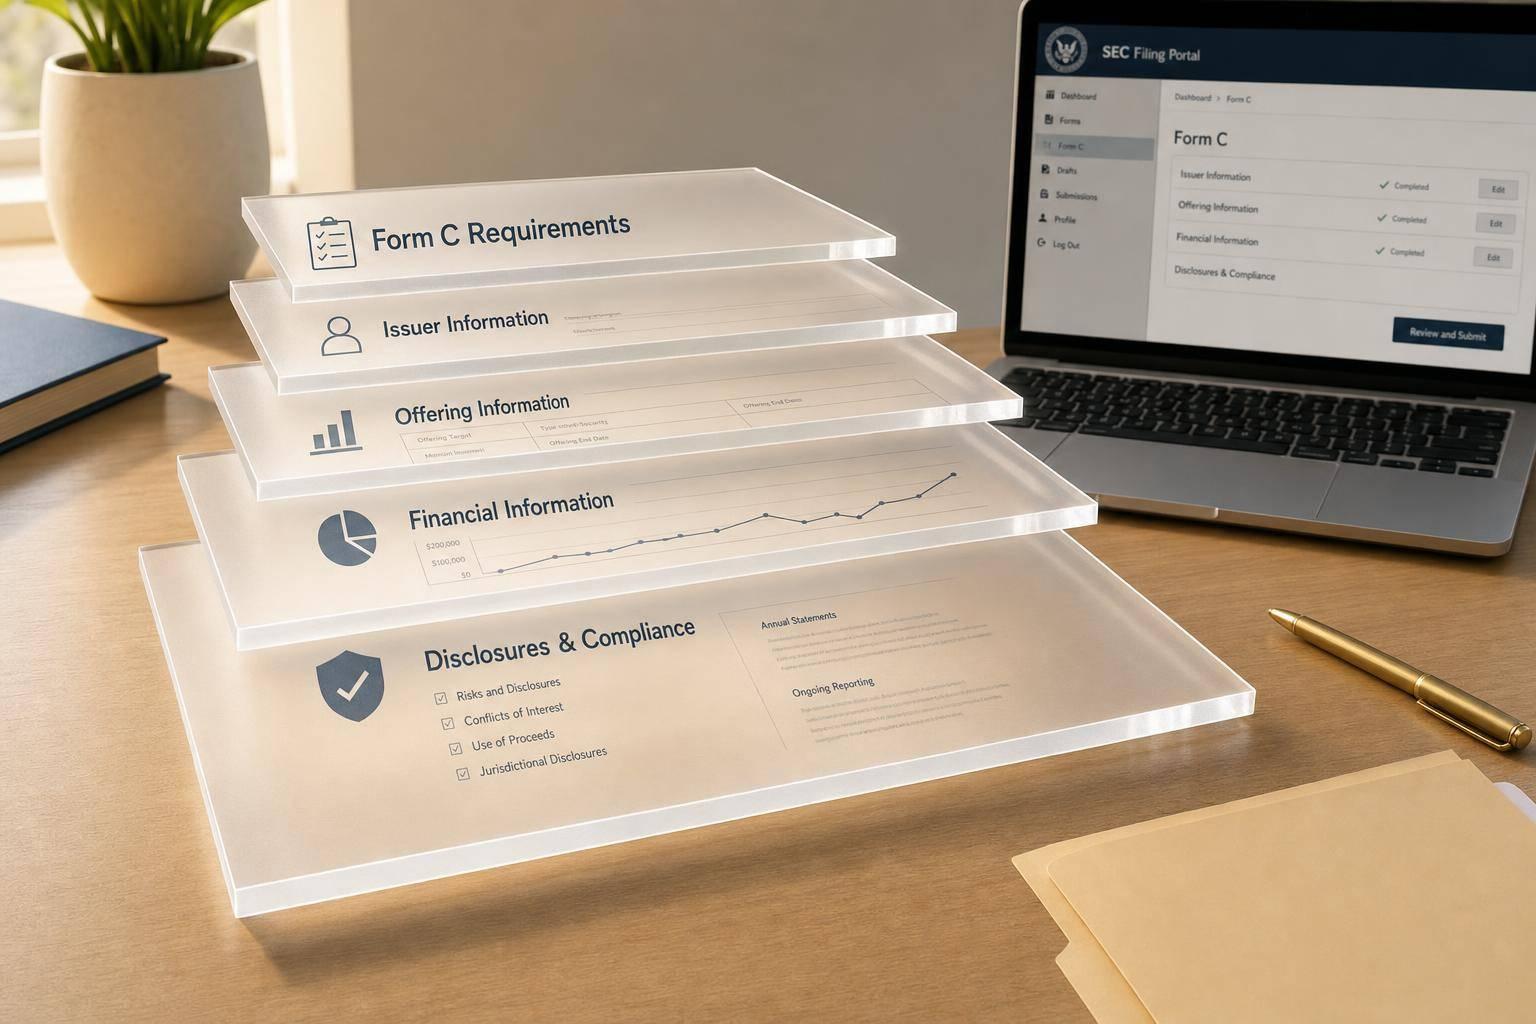
To calculate CAC (Customer Acquisition Cost) for any content channel accurately, you first need to pin down two things: which costs to include and how to assign credit for customer conversions. Missteps in either area can throw your numbers way off. Research even shows that basic CAC calculations often underestimate true acquisition costs by 40–45% [6].
The standard CAC formula is simple: total sales and marketing spend ÷ number of new customers acquired during a specific period. But when it comes to content marketing, figuring out what counts as "total spend" can get tricky.
Most teams only factor in direct production costs - like freelancer fees, ad spend, or a tool subscription. However, a more accurate content CAC calculation includes a broader range of costs. Here's a breakdown of key cost categories to consider:
| Cost Category | What to Include | Allocation Method |
|---|---|---|
| Headcount | Salaries, benefits, payroll taxes, and bonuses for writers, SEOs, designers, and managers | Based on the percentage of time spent on content [7][9] |
| Production | Freelancer fees, agency costs, stock photos, video editing | Direct cost per asset [7][8] |
| Software | CMS, SEO tools (e.g., Ahrefs, Semrush at ~$400/month), email platforms, attribution tools | Monthly subscription cost [7][8] |
| Promotion | Paid social ads, sponsored newsletters, link-building outreach | Direct spend per campaign [8][6] |
| Overhead | Office space, IT, HR support | Typically 10–15% of direct headcount costs [7] |
For context, fully loaded headcount costs in the U.S. are about 1.25–1.35x the base salary once benefits and payroll taxes are included [7]. For example, if a content manager earning $80,000 annually spends 50% of their time on content, you should attribute $50,000–$54,000 to content CAC - not just $40,000.
Attribution plays a huge role in determining which content channels get credit for customer conversions. This directly impacts your CAC numbers and how you evaluate channel performance.
"Traditional models isolate channels... This siloed approach ignores the reality of modern customer journeys." - Tristen Taylor, HubSpot [6]
The three most common attribution models each offer something different:
For many B2B content programs, starting with last-touch attribution as a baseline and adding first-touch data for top-of-funnel assets is a practical approach. Multi-touch attribution becomes more important when your sales cycle involves multiple interactions and spans several months.
Accurate CAC tracking also depends on aligning measurement periods with your attribution model. For example, content published in January might lead to customer conversions in March or April. If you match January's production costs with January's new customers, your CAC numbers could be way off.
"CAC is not a vanity metric you calculate once for a pitch deck. It is an operational metric you should track monthly, by channel, and use to make real resource allocation decisions." - itsdeep.io [3]
A 3-month rolling average works for most businesses. For B2B SaaS, a 90-day window is common, while enterprise deals may require 6–12 months. Beyond timing, it’s also essential to segment your CAC by customer cohort - like self-serve versus sales-assisted conversions - since these groups often have very different cost dynamics [9][6].
Once you’ve set up attribution models, the next step is to pinpoint and allocate your content marketing costs accurately. This step is critical for refining your customer acquisition cost (CAC) calculations. Without precise cost data, your CAC could be way off. In fact, many teams underestimate their true content marketing expenses by 40–60% because they only account for direct costs like ad spend or freelancer payments, ignoring other key factors [7].
Content marketing expenses generally fall into five main categories: production, personnel, technology, promotion, and overhead. Let’s break these down:
Don’t forget to include your own time if you’re contributing directly. For example, if you spend 10 hours a month writing SEO content and value your time at $100/hour, that’s an additional $1,000/month to account for [2].
For shared costs, divide them based on the proportion of time or budget each channel uses. For example, if a team member spends 30% of their time on email marketing, assign 30% of their salary to that channel [7][6]. Similarly, tools should be assigned to the channels they support - Ahrefs goes under organic search, Mailchimp under email, and general tools like Salesforce can be categorized as shared overhead [7].
"Distribute shared costs based on each channel's percentage of total direct spend or customer volume." - Tristen Taylor, HubSpot [6]
If your content serves both acquisition and retention, only include the acquisition portion in your CAC. For instance, if 70% of your content focuses on attracting new customers, allocate just 70% of the production budget to CAC [6].
To ensure your CAC calculations are reliable, your marketing cost data must align with your financial systems, often requiring the oversight of fractional CFO services. Without this integration, your numbers might stay stuck in a spreadsheet that your finance team won’t trust.
"The measurement gap is not a content quality problem - it is an attribution infrastructure problem." - Digital Applied [8]
Direct production expenses should flow through accounts payable or your ERP system. Internal labor costs can be calculated using project management tools like Asana or Jira. To estimate these costs, multiply an employee’s annual salary by 1.3 (to include benefits and taxes) and divide by 2,080 working hours [8].
For smaller teams without enterprise-level systems, Google Sheets can act as a practical workaround. Use it to consolidate cost data from various sources, then integrate it into a BI tool like Looker Studio alongside GA4 data for a complete view [8].

Content Marketing CAC by Channel: Costs, Benchmarks & LTV Ratios
This section builds on the earlier cost allocation and attribution models, walking you through how to finalize channel-level CAC (Customer Acquisition Cost) calculations with precision.
Once you've allocated costs accurately, calculating CAC is simple: divide the total channel-specific costs by the number of customers acquired through that channel within a set timeframe. The tricky part? Ensuring both your costs and customer counts are spot-on.
| Channel | Cost Inputs (Numerator) | Denominator |
|---|---|---|
| Organic Search / SEO | Salaries + Production + SEO Tools (e.g., Ahrefs at ~$180/month) + Agency Fees | Customers from Organic Search |
| Email Newsletter | Email Platform Fees + Writer Salary Allocation + Design Costs | Customers Acquired via Email |
| Referral / Partner | Program Costs + Partner Team Salaries + Commissions | Customers via Referrals |
| Paid Content Promotion | Ad Spend + Agency Fees + Headcount Allocation | Customers from Paid Channels |
Here’s an example: If your SEO efforts cost $8,500 per month (including salaries, tools, and freelancers) and bring in 17 customers, your organic CAC is $500 per customer. That’s a solid figure, especially considering 2026 SaaS benchmarks place organic search CAC between $200 and $940, with payback periods ranging from 6 to 18 months [2].
Once you've nailed down channel-specific costs, you'll need to sync these numbers with advanced analytics systems for a complete picture.
The real challenge lies in accurately tying customer acquisitions to their respective channels. While GA4 (Google Analytics 4) can track traffic and user behavior, your CRM holds the key to closed-won revenue data. Without connecting these systems, you're left with incomplete insights.
A practical solution? Embed the GA4 Client ID into hidden CRM lead form fields. This allows you to directly link specific content interactions - blog visits, email clicks, or YouTube views - to deals in your sales pipeline [8]. Platforms like HubSpot or Salesforce then make it easier to calculate channel-specific acquisition numbers.
Remember, average CAC figures can hide huge variations between channels. Some might deliver customers for $50, while others could cost $1,200 or more. Consistent UTM tagging is vital here for improving multi-channel attribution accuracy [11].
Analytics tools often excel at tracking quick conversions, but long-payback channels like SEO or evergreen content require a different approach. These channels don’t follow a linear path. For instance, someone might discover a blog post today, revisit it multiple times over months, and only convert much later. A typical 30-day attribution window would miss most of that journey.
To account for this, adjust GA4’s lookback window to 90 days and apply a 10% monthly decay rate for content older than 12 months. This method balances gradual declines in content performance without unfairly penalizing channels with longer sales cycles. Keep in mind, B2B content marketing often takes 9–18 months to break even, so evaluating it with short-term metrics can paint an overly negative picture [12].
Once you've accurately allocated costs across your channels, benchmarks can highlight where adjustments are needed. But first, you need to determine if your CAC (Customer Acquisition Cost) is truly an issue. Benchmarks provide that clarity. For example, in 2026, B2B SaaS companies report CAC for organic search ranging from $200 to $940, while referral channels often deliver much lower CACs, typically between $50 and $200 per customer [2]. If your SEO CAC is hitting $1,200, it’s a clear sign something’s off - whether it’s your conversion rates, content quality, or cost tracking.
However, the most telling metric isn’t channel CAC alone - it’s your LTV:CAC ratio. A healthy SaaS business aims for a 3:1 ratio, meaning your customer lifetime value (LTV) should be three times your CAC [2][3]. If a channel is operating at a 1:1 ratio or worse, you’re losing money on every customer it brings in. On the flip side, a ratio above 5:1 could indicate you’re not investing enough in a channel that’s performing exceptionally well [2][3][5].
If you’re looking to reduce CAC, improving conversion rates is one of the most effective strategies. Why? Doubling your conversion rate has the same impact as doubling your traffic - but at half the cost. Regular A/B testing on landing pages - adjusting headlines, CTAs, or social proof elements - can yield significant results. For instance, even a modest 20% boost in conversion rates translates directly into a 20% reduction in CAC for the same budget [9][13].
Another way to bring down CAC is by focusing on bottom-of-funnel (BOFU) content. Formats like competitor comparison pages, ROI calculators, and use case guides tend to attract leads who are closer to making a purchase. A great example: DataSync, a B2B data integration company, slashed its CAC from $8,500 to $5,100 (a 40% drop) over 12 months by creating 40 competitor comparison pages and 15 use case guides. This strategy drove a 340% increase in organic traffic [4]. Similarly, ScaleOps reduced its overall CAC by 45% and shaved 22 days off its sales cycle by building a content engine centered on technical guides and a template library [4].
AI tools also play a growing role in reducing CAC. In fact, 68% of businesses report better ROI from content marketing after adopting AI tools, largely because these tools cut production costs without compromising strategic quality [12].
The key to sustaining these gains? Consistent tracking and analysis.
Tracking CAC regularly is essential for ongoing improvements. A 3-month rolling average works well for smoothing out timing gaps - especially for channels like organic search, where the sales cycle can be longer [3].
To streamline this process, integrate your analytics tools with your CRM and financial systems. This setup automates CAC reporting and ensures your data is always up-to-date. For example, Phoenix Strategy Group specializes in helping companies transition from manual calculations to real-time CAC dashboards, which combine financial data with detailed channel-level attribution. When your CAC numbers are automatically updated and linked to your profit and loss statements, it becomes much easier to make quick, informed decisions about where to scale up or pull back.
"If you can't measure it, you can't improve it. But more importantly, if you can't communicate it, you can't fund it." - Robert Rose, Chief Strategy Advisor, Content Marketing Institute [12]
Calculating CAC for content marketing channels involves a few essential steps. Start by identifying all costs - both direct and indirect - since many startups underestimate their CAC by as much as 40–60% when they overlook indirect expenses [7]. Then, distribute shared costs fairly across all channels. After that, select an attribution model that fits your sales cycle. Multi-touch models work particularly well for content marketing because customers often interact with multiple touchpoints before making a purchase. Finally, calculate the CAC for each channel and evaluate it against your LTV and payback period. These steps provide clarity and help guide smarter, more strategic decisions.
Accurate CAC data empowers you to reallocate spending from underperforming channels to those that consistently deliver better results. Organic content strategies, for instance, can reduce CAC by over 40% compared to paid channels [4]. Plus, assets like comparison pages or technical guides have long-lasting value, continuing to generate leads long after their initial production costs. Companies with strong content measurement systems report a median revenue return of 4.33:1 [12]. With these insights, you can confidently scale your content efforts and optimize your budget.
"The best content marketers don't measure success by how much content they produce. They measure it by how much revenue that content influences." - Joe Pulizzi, Founder, Content Marketing Institute [12]
For growing companies, one of the biggest hurdles is creating a reliable measurement system that integrates your CRM, analytics tools, and financial systems. This ensures that CAC figures stay up-to-date and directly align with your profit and loss statements. Phoenix Strategy Group specializes in building these systems. They help businesses implement True CAC models that factor in salaries and overhead, as well as set up detailed tracking by channel, customer segment, or region. Whether you're scaling, preparing for funding, or looking to optimize your content investment, a solid CAC measurement system signals financial readiness and supports sustainable growth.
To calculate content Customer Acquisition Cost (CAC) effectively, it’s better to assess costs on a per-channel basis instead of relying on a blended metric. This means dividing your total content marketing spend - including time, tools, and resources - by the number of new paying customers directly generated through your content efforts.
Additionally, using a multi-channel attribution model is highly recommended. It acknowledges content’s role throughout the customer journey, ensuring its contribution to conversions is accurately represented. This approach allows for better insights and smarter strategy adjustments.
To properly assign salaries and overhead to your content channels, factor these indirect costs into your total content marketing budget. Then, divide the costs proportionally based on the effort put into each channel. This could mean tracking team hours spent per channel or calculating each channel's share of total content output. For instance, if your team dedicates 40% of their time to blog posts, you would allocate 40% of salaries and overhead to that channel.
To calculate CAC for SEO in scenarios with a lengthy sales cycle, you need to factor in delayed attribution. Start by estimating the total SEO costs, which include expenses like technical optimizations, content creation, and labor. Then, track the number of new customers acquired through organic search over a longer timeframe.
Instead of relying on last-click attribution, consider using multi-touch attribution models. These models better recognize SEO's contribution across the entire customer journey. Lastly, ensure that your CAC remains in balance with the customer lifetime value (LTV) to sustain growth during the extended conversion period.