Published on
February 13, 2026


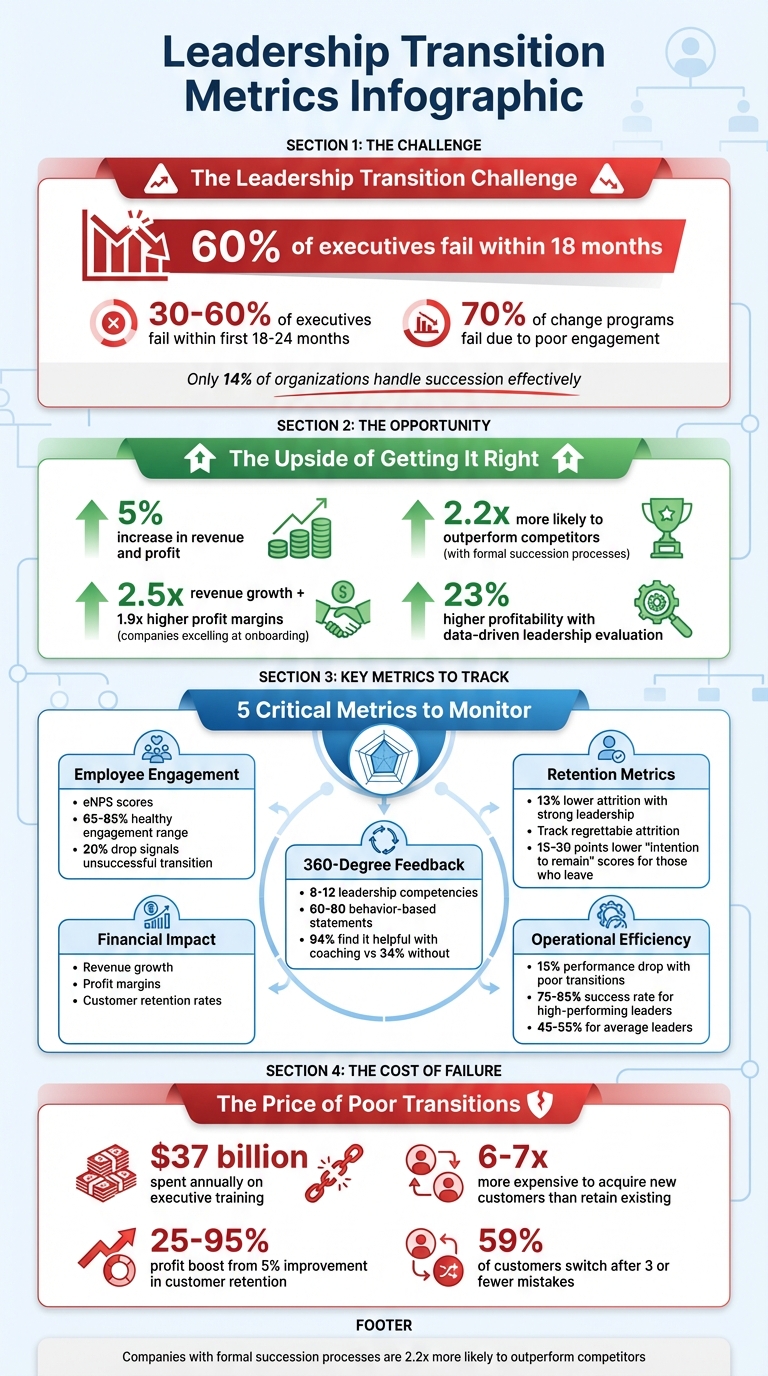
Leadership transitions are challenging, with up to 60% of executives failing within 18 months. Poor transitions can lead to costly setbacks, including employee turnover spikes and performance dips. But when done right, they can boost revenue and team success.
The key? Tracking the right metrics. Here's what you should monitor:
These metrics help identify issues and guide adjustments in real time, ensuring smoother transitions and better outcomes.
Leadership Transition Metrics: Key Statistics and Success Indicators
Keeping tabs on employee engagement during transitions is essential for spotting whether things are running smoothly or hitting roadblocks. Engagement metrics help gauge how employees are adjusting by focusing on three areas: how they feel about the change (sentiment), what actions they’re taking (behavior), and what results are coming out of it (outcomes) [5].
To keep a pulse on engagement, use the Employee Net Promoter Score (eNPS). This single-question survey - "How likely are you to recommend this company to a friend?" - offers a quick snapshot of employee sentiment. Pair it with biweekly pulse surveys over the six- to nine-month transition period [4][6]. Compare scores from before, during, and after the transition to track patterns. For instance, unsuccessful transitions often see engagement scores drop by 20%, while successful transitions with strong leadership show 13% lower attrition rates [6].
Behavioral indicators often hint at disengagement before sentiment scores reveal issues. Pay attention to one-on-one meeting completion rates - fewer meetings can signal early signs of disengagement [4]. Other red flags include rising absenteeism and missed deadlines, which often precede emotional withdrawal [5]. A practical example comes from Schneider Electric in 2024, where facilitated feedback workshops during the first six months of an executive hire uncovered team burnout. This insight allowed the leader to adjust priorities and resolve a major project crisis by aligning stakeholders more effectively [6].
Retention metrics also provide a clear picture of leadership impact. Focus on regrettable attrition, which involves losing top performers or employees in critical roles [4]. For example, employees who leave within a year often report "intention to remain" scores 15–30 points lower than those who stay [7]. Track voluntary turnover among the leader’s direct reports every quarter, breaking the data down by tenure, role, and manager to pinpoint specific team issues [5][2]. As John Gave of The Metiss Group aptly puts it:
Employees rarely leave companies - they leave managers [2].
Internal mobility rates can reveal whether employees trust the new leadership to support their career growth. When feedback systems clearly outline career pathways, employees are more likely to stay. In fact, two-thirds of employees say they’d remain longer if they saw clear internal advancement opportunities [4]. Keep an eye on how often team members move into new roles and whether the leader is actively preparing their direct reports for promotions. Companies that excel at onboarding and retaining talent see 2.5× revenue growth and 1.9× higher profit margins [6].
To get a full picture of a leader's performance, it's essential to gather feedback from multiple sources - managers, peers, direct reports, and key collaborators. This broad feedback approach complements earlier employee engagement metrics, ensuring leadership transitions are evaluated from all angles. Interestingly, over 95% of organizations rely on external providers for these assessments rather than developing them in-house [8][9]. Below, we’ll explore how to design, implement, and evaluate these reviews effectively.
A well-structured 360 feedback system typically measures 8–12 leadership competencies using 60–80 behavior-based statements [9]. These statements should focus on observable actions, such as "tailors messages to the audience" or "delegates tasks efficiently", ensuring leaders can take actionable steps to improve [8]. A 7-point Likert scale is recommended to capture nuanced perceptions from different groups [9].
For accurate and anonymous results, select 8–15 raters, ensuring at least three people represent each group (e.g., peers, direct reports) [9]. Leaders should help pick their raters, with managerial oversight, to encourage buy-in and openness to the results [9]. To avoid overwhelming participants, limit open-ended questions to just two or three, such as "What are their greatest strengths?" or "What specific areas need improvement?" [9].
Once the surveys are completed, schedule a 90-minute coaching session within 30 days to review the results and create an action plan [9]. This step is crucial: 94% of leaders who engage in coaching and goal-setting after a 360 review report finding the process helpful, compared to only 34% who skip this step [9].
For meaningful insights, use a two-cycle assessment process. Start with a baseline 360 review, followed by a second evaluation (sometimes called 720-degree feedback) 12–18 months later [8][13]. Focus on tracking behavioral improvements - like better conflict resolution or enhanced communication skills - rather than external performance metrics like revenue, which can be influenced by factors beyond the leader's control [12][13]. Pay attention to discrepancies between self-ratings and observer feedback, as leaders who consistently overrate themselves may be at risk of derailing [11].
As Dana Washington from DDI explains:
360-degree feedback is a call to action, not a report to put away until the next assessment [13].
To ensure progress, set accountability checkpoints at 30 days and six months. These touchpoints help leaders maintain focus on practicing new behaviors before the next formal review [12]. Monitor both task-oriented leadership (e.g., organizing, delegating) and interpersonal leadership (e.g., mentoring, resolving conflicts), as weaknesses in either area can increase the likelihood of failure during leadership transitions [11].
Feedback from senior leaders and board members provides an additional layer of insight, especially when evaluating strategic alignment. While direct reports often focus on emotional intelligence or day-to-day management, stakeholders bring a broader perspective, assessing how well the leader communicates and executes company strategies [10][14]. They can also highlight which leadership skills will become critical in the next 3–5 years and identify current gaps [10].
To ensure accountability, require leaders to share their 360-based action plans with supervisors or board members. This step helps secure ongoing support and reinforces commitment [9]. Research from the Center for Creative Leadership emphasizes:
Peer ratings tend to be the best predictor of whether a leader is at risk of derailing [11].
When it comes to leadership transitions, financial and operational metrics play a crucial role in evaluating success. While feedback systems focus on behavioral changes, the real impact often shows up in the numbers.
A successful leadership transition can drive a 5% increase in revenue and profit, whereas a poorly executed one often results in losses [16][3]. Keeping a close eye on individual business units is essential - any performance decline could signal financial trouble [3][17]. For public companies, fluctuations in shareholder value and stock price after the announcement and during the first few quarters reveal market confidence in the new leader [3].
To gauge the return on investment (ROI), compare onboarding and training costs with productivity gains and improved retention rates [15]. Analyzing profit margins ensures these gains are sustainable. Another critical factor is turnover among the new leader's direct reports - high turnover can lead to significant recruitment costs and lost productivity, potentially overshadowing the initial investment in the transition [15][16]. In fact, companies spend around $37 billion annually on executive training to mitigate these risks [3].
Leadership transitions can disrupt customer relationships, especially when the outgoing executive had strong client ties. Metrics like the Net Promoter Score (NPS) are valuable for tracking customer confidence before and after the change, as they predict revenue growth and contract renewals [21]. The Customer Retention Rate (CRR) is another critical metric, calculated as ((End Customers – New Customers) / Start Customers) × 100 [19][20]. It helps determine if customers remain loyal despite internal shifts.
Customer Lifetime Value (CLV) is equally important, as it measures whether the new leader is nurturing high-value relationships rather than focusing solely on new acquisitions [19][22]. Retaining existing customers is far more cost-effective - keeping a customer costs 6-7 times less than acquiring a new one, and a 5% improvement in retention can boost profits by 25% to 95% [19][20]. Tools like automated CRM alerts can flag early signs of customer dissatisfaction, such as reduced login frequency or feature abandonment, which are strong indicators of potential churn [23].
As Cary Self, VP of Education at CustomerGauge, points out:
If you do not treat each of your customers like a brand-new prospect by listening to feedback and acting quickly on it, someone else will! [21]
Operational metrics like First Contact Resolution (FCR) and Average Resolution Time (ART) are also important. They ensure customer support quality remains intact during the leadership transition. Remember, 59% of customers will switch providers after just three mistakes or fewer [22], so even minor missteps can have long-term consequences.
Operational metrics provide a clear picture of whether the new leader is driving or hindering performance. Key indicators include output per hour and annual productivity growth - teams with poorly managed transitions often see a 15% performance drop among direct reports [16].
Monitoring process cycle times for routine tasks and time-to-market for new products is essential. Decision velocity, or the time it takes to move from problem identification to implementation, is another critical metric. A slowdown here could indicate that the new leader is creating bottlenecks rather than streamlining processes [25]. Additionally, tracking error rates in production or service delivery, as well as system downtime, helps ensure operational stability during the transition.
Companies that use data-driven leadership evaluation report 23% higher profitability and 19% faster revenue growth [26]. Tools like Tableau or Power BI can help visualize these metrics in real time, enabling proactive adjustments if productivity begins to dip [16][24]. High-performing leaders typically achieve success rates of 75-85% on strategic initiatives, compared to just 45-55% for average leaders [26]. These differences often become evident quickly in operational data.
Before the transition begins, establish baseline metrics and set SMART goals (Specific, Measurable, Achievable, Relevant, and Time-bound) for the leader's first and third years [16][18]. The initial 90 days are particularly critical, as the trends during this period often set the tone for the leader's entire tenure [16]. Together, these financial and operational metrics provide a comprehensive view of the transition's effectiveness, complementing feedback-driven insights.
Gathering feedback is just the starting point - you need effective systems to turn that input into meaningful action. Real-time tracking tools play a key role here, ensuring feedback leads to timely adjustments during leadership transitions. Without proper tracking, critical insights risk being ignored. Real-time monitoring helps identify issues early, allowing you to address them before they escalate into bigger problems.
Before a leadership transition begins, it’s crucial to define clear benchmarks for the metrics you plan to monitor. Start by measuring employee engagement scores, turnover rates, and operational performance before the new leader steps in. These baseline numbers provide a reference to determine whether changes stem from the transition or other unrelated factors [28].
As management consultant Peter Drucker famously said:
What gets measured gets improved [2].
Focus on key metrics like your Employee Net Promoter Score (eNPS). Healthy organizations typically see engagement levels between 65% and 85% [27]. Another important measure is "bench strength", which refers to the number of qualified successors available for critical roles. A strong ratio is at least three qualified candidates per position [28].
For example, Hitachi Energy implemented a leadership program between 2023 and 2025 that reduced salaried turnover by 80% and hourly turnover by 25%. This initiative saved the company an estimated $20 million over 18 months [28]. Such success begins with understanding your starting point. Once baselines are established, tools like visual dashboards become essential for tracking progress.
Dashboards turn raw feedback into visual insights that leaders can grasp quickly. Tools like Tableau, Power BI, Qualtrics, and Microsoft Viva make it easier to identify trends and patterns [29][30]. A well-designed dashboard should present key metrics in under 60 seconds [29].
Color coding, such as the "RAG" system (Red, Amber, Green), helps highlight areas needing immediate attention [29]. Leaders using interactive dashboards are 68% faster at deriving actionable insights, and organizations adopting these tools report 24% lower attrition rates [30]. Sonia Boyle, Chief People Officer at Gore Mutual Insurance, underscores the value of these tools:
People data analytics has transformed how we make decisions - from hiring to promoting - and has elevated the status of the HR team [30].
AI-powered text analysis can also summarize large volumes of feedback in minutes, uncovering patterns that might otherwise go unnoticed [30][32]. This is particularly helpful during leadership transitions when feedback comes from multiple sources.
Having clear benchmarks and real-time visuals is only part of the equation - acting swiftly on feedback is just as important. Real-time feedback is only effective if it leads to immediate action. Establish a continuous process: collect, analyze, prioritize, act, and communicate [32][33]. Teams with managers who respond to employee feedback see approximately 30% lower attrition rates [31].
A helpful framework is the 1-2-3 Rule for Action: when feedback highlights an issue, focus on one topic, take two concrete steps to address it, and follow up three times to track progress [31]. This method keeps efforts targeted and shows visible results. Organizations that address the emotional aspects of transitions are 2.5 times more likely to achieve a successful leadership change [34].
Close the loop by sharing updates with employees. When people see their feedback leading to real changes, they’re 24% more likely to provide input in the future [31]. It’s worth noting that 70% of change programs fail due to poor employee engagement and communication [34]. Early wins based on feedback not only build trust in new leaders but also set the stage for larger, long-term improvements. These systems ensure leadership transitions are smoother and contribute to overall organizational success.
Leadership transitions don’t have to feel like a gamble. By focusing on the right metrics - like employee engagement, turnover rates, 360-degree feedback, and financial performance - you can turn uncertainty into a structured, measurable process. The numbers back this up: well-executed transitions contribute to 5% higher revenue and profit levels, while mismanaged changes can lead to a 15% drop in business unit performance [3][16].
The challenge lies in bridging the gap between intention and execution. While 86% of leaders recognize the urgency of succession planning, only 14% feel their organizations handle it effectively [1]. This disconnect can come at a steep cost, with 30% to 60% of executives failing within their first 18 to 24 months [3]. The key to success? Establishing clear KPIs, monitoring progress in real time, and acting swiftly when adjustments are needed.
Real-world examples highlight the power of these metrics. A healthcare CEO used coaching feedback to multiply revenue by four over three years, while a European manufacturing company reversed a seven-year decline by implementing 360-degree reviews [35][36].
To ensure smooth leadership transitions, start by setting SMART goals, use dashboard tools to track trends, and create feedback loops for rapid course corrections. Monitoring feedback metrics, alongside baseline KPIs, helps align leadership goals with organizational needs. Companies with formal succession processes are 2.2 times more likely to outperform their competitors [16]. By measuring what truly matters - from operational continuity to leadership alignment - you can safeguard both your team and your financial performance during these pivotal moments.
At Phoenix Strategy Group, we specialize in guiding leadership transitions with data-driven strategies that ensure operational stability and foster growth.
In the first 90 days, it’s important to keep an eye on metrics that show how a leader is settling in and making an impact. Focus on areas like early wins that help establish credibility, how well they’re adapting to the company’s culture, the dynamics within their team, and progress on key strategic goals. Tracking these elements ensures they’re aligned with the organization’s values, building strong relationships with stakeholders, and tackling challenges early - laying the groundwork for future success.
To establish baseline KPIs, concentrate on metrics that evaluate both leadership preparedness and the overall health of the organization. Some key areas to measure include successor readiness, identification of skill gaps, achievement of development milestones, and the strength of the talent pipeline. Specific metrics to monitor might include:
Setting these KPIs in advance creates a clear reference point to measure leadership performance after a transition. It also helps ensure smooth organizational continuity during periods of change.
To determine if turnover is linked to organizational changes or simply part of regular employee movement, consider whether departures align with leadership shifts or structural changes. Focus on key factors like the timing of exits, reasons cited for leaving, and any overlap with leadership succession or restructuring efforts. This approach can reveal whether turnover patterns are connected to specific transitions or are part of the usual employee lifecycle.