Published on
February 13, 2026

Leverage ratios measure how much debt a company uses compared to equity, assets, or earnings. They are especially important in manufacturing, a capital-heavy industry requiring significant investments in machinery and facilities. Here's what you need to know:
Manufacturers can use these ratios to optimize their capital structure and balance debt with equity effectively.
Manufacturing Leverage Ratios: Key Benchmarks and Industry Averages 2024
Calculating the Debt-to-Equity (D/E) ratio is simple: divide total liabilities by total shareholders' equity. This calculation shows how much debt a company is using for every dollar of equity. For example, Apple Inc.'s D/E ratio in Q1 2024 was 3.77, based on $279 billion in liabilities and $74 billion in equity[6].
However, many analysts prefer to focus on long-term debt rather than total liabilities. Why? Because short-term obligations, like accounts payable, typically carry less risk than long-term loans[6]. Using the formula Long-term Debt ÷ Shareholder Equity provides a sharper view of a company's structural leverage and refinancing risks. This is especially relevant for manufacturing businesses, which often require significant investments in machinery and facilities[9]. With this foundational calculation, you can start comparing industry-specific benchmarks.
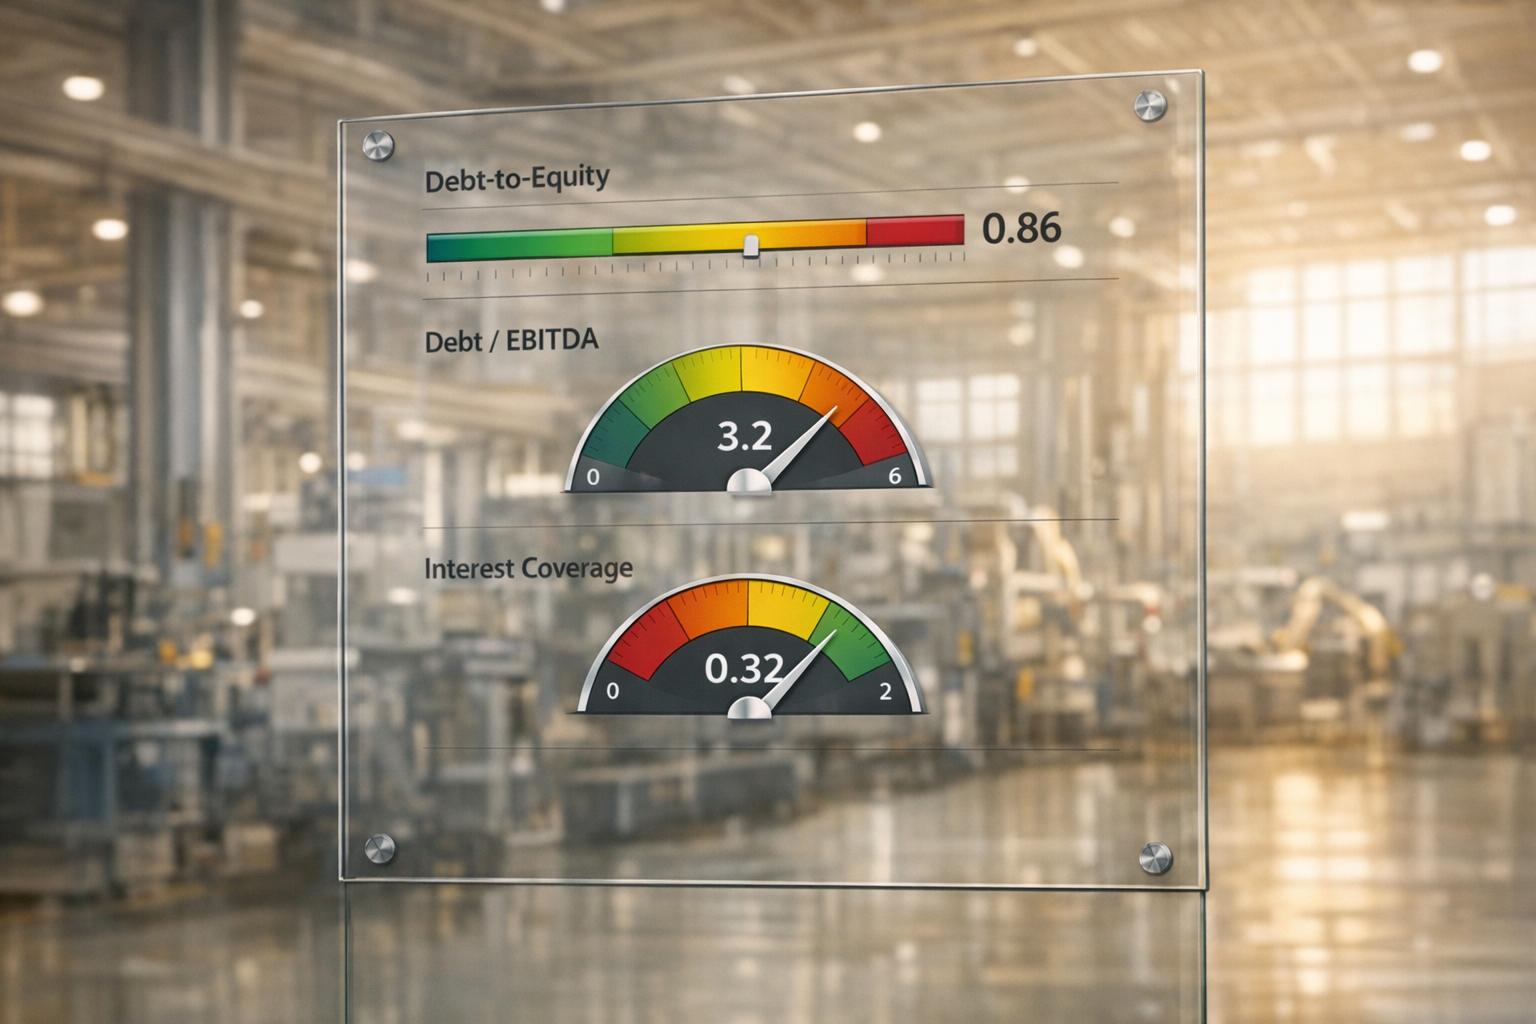
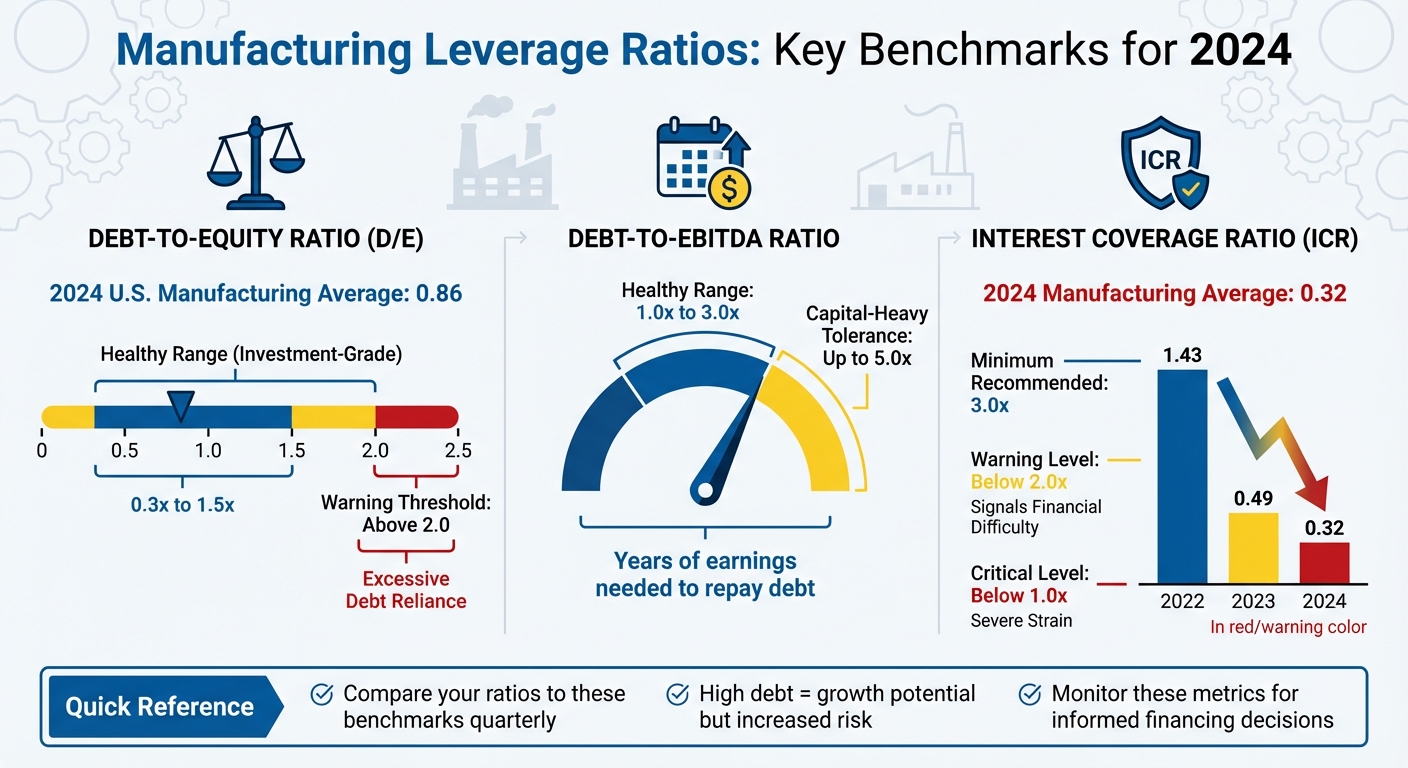
Once you've calculated the D/E ratio, it's important to understand how these numbers vary across manufacturing sub-sectors. In 2024, the average D/E ratio for U.S. manufacturing companies rose to 0.86, up from 0.72 in 2023 and 0.58 in 2022[5]. This upward trend suggests that manufacturers are relying more on borrowed funds for expansion and equipment upgrades. However, benchmarks can differ widely depending on the specific sub-sector, driven by varying capital needs and market conditions.
| Manufacturing Sub-Sector | 2023 D/E Ratio | 2022 D/E Ratio |
|---|---|---|
| Chemicals and Allied Products | 0.70 | 0.48 |
| Industrial & Commercial Machinery | 0.95 | 0.86 |
| Transportation Equipment | 1.08 | 0.94 |
| Fabricated Metal Products | 1.09 | 1.07 |
| Food and Kindred Products | 1.28 | 0.86 |
| Paper and Allied Products | 1.90 | 1.98 |
These figures highlight how financial structures differ across manufacturing sub-sectors. For example, fabricated metal products and food production tend to have higher D/E ratios, reflecting their capital-intensive nature and exposure to cyclical risks. In contrast, the S&P 500 averaged a D/E ratio of 0.61 in Q4 2024, while the overall U.S. market reached 1.32[7][9]. A ratio above 2.0 often signals heavy reliance on debt, meaning two-thirds of the company's capital comes from borrowed funds[8]. Manufacturing generally operates with less leverage compared to industries like banking (9.10) or insurance (4.04), which benefit from more predictable cash flows[7].
A high D/E ratio can fuel growth during profitable times but also increases risk during economic downturns due to fixed interest obligations[6][8]. In manufacturing, higher ratios often reflect the need for substantial capital investments rather than signs of financial trouble[8][9].
On the other hand, a low D/E ratio indicates cautious financing with a strong equity base, which is usually appealing to lenders and investors[6][8]. But going too low has its downsides. Companies that avoid debt entirely might miss out on tax-deductible interest benefits or lack the funds for crucial upgrades and capacity expansions[6][8].
Understanding these ratios in context is key. For example, a 1.28 ratio might be perfectly normal for food production but could raise red flags in chemical manufacturing[7]. Comparing your D/E ratio to competitors in your sub-sector helps you strike the right balance between debt and equity for steady growth.
The Debt-to-EBITDA ratio evaluates a company's ability to manage and repay its debt using its earnings before interest, taxes, depreciation, and amortization (EBITDA) [11]. To calculate it, you divide the total debt by EBITDA. Since this ratio excludes non-cash expenses like depreciation and tax fluctuations, it acts as a proxy for cash flow and helps lenders assess how much debt a company can handle. This metric is especially relevant for manufacturers, who often face high capital expenditures for machinery, which can reduce the free cash flow available for debt repayment. As Ellen Beckner, Syndicated Finance Group manager at J.P. Morgan, explains:
If you have significant capital expenditures every year to update machinery, you may not have as much free cash flow to pay down debt. [12]
A ratio above 1.0 generally means a company has more debt than it earns in a year. While a ratio around 3.0 is often considered manageable, some industries tolerate ratios as high as 4.5 or 5.0. For manufacturers in highly cyclical sectors, lower ratios are typically preferred to ensure debt obligations can still be met during economic downturns. Below, we explore the current benchmarks for this ratio in the manufacturing sector.
Debt-to-EBITDA targets vary significantly across industries, reflecting differences in capital requirements and market conditions. For midsize businesses, a ratio between 2.5 and 4 is often the target, though specific benchmarks depend on the sub-sector. As of February 2026, here’s how net Debt-to-EBITDA ratios compare across manufacturing categories [13]:
| Manufacturing Sub-Sector | Net Debt-to-EBITDA (Feb 2026) |
|---|---|
| Electrical Equipment & Parts | 0.42 |
| Auto Manufacturers | 0.57 |
| Steel | 0.80 |
| Metal Fabrication | 1.00 |
| Specialty Industrial Machinery | 1.36 |
| Aerospace & Defense | 1.41 |
| Chemicals | 1.99 |
| Apparel Manufacturing | 2.37 |
| Packaging & Containers | 3.74 |
These numbers highlight how capital intensity drives differences in leverage. For example, capital-light sectors like Electrical Equipment & Parts maintain low ratios, often below 1.0. On the other hand, capital-heavy industries, such as Packaging & Containers, operate with ratios closer to 4.0. As Ellen Beckner points out:
It's one of the first places we go to look at how much more debt a business can take on - both its maximum debt-to-EBITDA and its long-range target. [12]
In addition to these quantitative benchmarks, lenders also weigh qualitative factors, such as a company's management history and supplier relationships, when assessing its financial position.
Improving the Debt-to-EBITDA ratio requires addressing both debt and earnings. On the earnings side, increasing EBITDA is often more sustainable than aggressively cutting debt. Manufacturers can boost EBITDA by focusing on efficiency, managing costs, and refining pricing strategies. For example, investing in technology to improve productivity or optimizing inventory turnover to reduce the risk of obsolete stock can make a significant impact.
On the debt side, using excess cash flow to pay down obligations - whether short-term or long-term - directly lowers the ratio. If the ratio becomes too high, alternative financing options can help. Asset-based lending, which uses inventory or equipment as collateral, can provide additional leverage without overburdening cash flow. Equity financing is another option to fund growth without adding debt, though it does dilute ownership stakes. The key is finding a balance between pursuing growth and maintaining financial flexibility to handle economic fluctuations.
The Interest Coverage Ratio (ICR), also known as the Times Interest Earned (TIE) ratio, evaluates how well a company can cover its interest payments using its operating earnings [14]. The formula is straightforward:
Interest Coverage Ratio = EBIT / Interest Expense [14][15][16]
EBIT (Earnings Before Interest and Taxes) is calculated as revenue minus operating expenses, excluding interest and taxes [16].
In manufacturing, variations of this formula are sometimes used. For example, the EBITDA Interest Coverage Ratio excludes depreciation and amortization, while the EBIAT (Earnings Before Interest After Taxes) provides another perspective on a company’s ability to manage debt [14][15].
Manufacturing tends to experience more revenue volatility compared to industries with steady, regulated income. As a result, higher interest coverage ratios are often necessary. Analysts generally view a ratio of 3.0 or higher as the minimum acceptable level for manufacturers [14].
Here’s a breakdown of typical benchmarks:
Recent trends in the U.S. manufacturing sector reveal financial challenges. The average ICR for publicly traded manufacturers dropped from 1.43 in 2022 to 0.49 in 2023, and further declined to 0.32 in 2024. In comparison, the all-industry average stood at 1.62 in 2024 [5][10].
| Year | Manufacturing Sector Avg ICR | All Industries Avg ICR |
|---|---|---|
| 2024 | 0.32 | 1.62 |
| 2023 | 0.49 | 2.51 |
| 2022 | 1.43 | 3.04 |
| 2021 | -1.22 | 1.22 |
| 2020 | 0.59 | 2.20 |
Given these declining ratios, manufacturers face increasing pressure to improve their financial health.
Raising your interest coverage ratio involves either increasing EBIT or reducing interest expenses. Here are some practical approaches:
Operational Improvements
Debt Reduction
Regularly monitoring your ICR - ideally on a quarterly basis - can help you track financial trends and make timely adjustments [14]. It’s worth noting that rising corporate interest rates can put downward pressure on ICRs, which may limit opportunities to borrow, invest in technology, or grow your workforce [14].
Maintaining a healthy interest coverage ratio is critical for balancing your capital structure and minimizing financial risks. For manufacturers looking to strengthen their financial footing, working with experienced advisors - like those at Phoenix Strategy Group - can offer valuable guidance on optimizing key metrics and achieving stability.
Manufacturers often face a delicate balancing act when it comes to managing their capital structure. With substantial investments in machinery and high fixed costs that magnify earnings volatility, finding the right mix of debt and equity is about more than just keeping borrowing costs low - it’s about managing risk effectively [2][3].
Debt financing can be a double-edged sword. On one hand, it can boost returns when the assets funded by debt generate profits exceeding borrowing costs. On the other hand, fixed interest obligations remain, even during tough times, which can strain finances [3]. Equity financing, while avoiding these fixed payments, doesn’t provide the same leverage to boost shareholder returns and requires giving up full ownership [3]. The challenge lies in ensuring that debt-financed investments yield returns high enough to justify the added expense.
The industry’s 2024 average debt-to-equity ratio of 0.86 serves as a useful benchmark [5]. Companies significantly exceeding this ratio may find themselves facing higher borrowing costs or limited credit access. On the flip side, those with ratios far below this benchmark might be missing opportunities to enhance returns by strategically using debt [3]. Manufacturers, in particular, tend to have higher debt-to-equity ratios than the U.S. average of 54.62% due to their heavy reliance on fixed asset investments [3].
Before taking on more debt, it’s crucial to assess operating leverage - the proportion of fixed costs to revenue. If this ratio is over 50%, your earnings are already highly sensitive to sales fluctuations, and adding financial leverage could further increase risk [1][2]. This careful balance is essential for making sound financing decisions.
Leverage ratios are critical tools for guiding major financial decisions, from purchasing equipment to determining dividend policies. For instance, when evaluating new investments in machinery or facilities, compare your current debt-to-equity ratio to the industry average of 0.86. This can help you decide whether to pursue debt or equity financing [5]. Asset-backed loans, secured by equipment, can often provide favorable financing options [1][2].
For growth initiatives like acquisitions, leverage should only increase if the expected returns exceed the after-tax cost of debt by 1.5–2.0% [18]. With the federal corporate tax rate at 21%, a 6% loan interest rate results in an effective after-tax cost of 4.74%. This means new investments should achieve a return of at least 6.24%–7.24% to justify taking on additional debt.
When it comes to shareholder payouts, such as dividends or share buybacks, it’s essential to monitor your debt levels closely. Ensure your interest coverage ratio stays above 3.0x and maintain liquidity equivalent to 12–24 months of cash or available credit [18]. Set internal triggers for deleveraging at thresholds 1.5x higher than your lender’s minimum requirements. For example, if your lender requires a minimum interest coverage ratio of 2.0x, consider halting distributions as you approach 3.0x.
Staying compliant with debt covenants requires proactive management. Regularly conduct stress tests to simulate scenarios like a 20% revenue drop or a 200–300 basis point rise in interest rates. These tests help you gauge your resilience against lender-imposed limits [18]. Additionally, avoid concentrated debt maturities by ensuring no more than 20–30% of your total debt comes due within a single year [18].
A recent example shows how monitoring leverage ratios can help manufacturers navigate complex financial decisions. Between 2022 and 2024, the average debt-to-equity ratio climbed from 0.58 to 0.86, while the interest coverage ratio dropped from 1.43 to 0.32 [5]. A manufacturer paying attention to these metrics in early 2023 would have spotted the warning signs: interest coverage falling below the recommended 3.0x threshold and a debt-to-equity ratio exceeding the 2023 industry average of 0.72 [5]. These trends should have triggered a review of the company’s capital allocation and operational strategies.
Companies that maintained a debt-to-equity ratio near the 2024 average of 2.37 managed to stay liquid despite market volatility [5]. Meanwhile, those that ignored declining interest coverage likely faced tighter borrowing conditions or higher interest rates [3]. By using leverage ratios as forward-looking tools, manufacturers can address potential issues before they escalate into major challenges.
For manufacturers juggling these trade-offs, partnering with seasoned financial advisors can make all the difference. Firms like Phoenix Strategy Group specialize in creating integrated financial models, tracking key leverage metrics, and helping businesses make informed decisions about debt, equity, and overall capital allocation.
Keeping an eye on leverage ratios is essential for managing growth effectively. The debt-to-equity ratio is a key indicator of a company’s capital structure. For investment-grade manufacturers, this typically ranges from 0.3x to 1.5x, with the 2024 industry average landing at 0.86 [5][16]. If this ratio exceeds 2.0x and cash flows are unstable, it signals risky leverage, which could restrict access to capital [16].
The debt-to-EBITDA ratio measures how many years of earnings it would take to pay off debt. Healthy manufacturers usually fall between 1.0x and 3.0x, though capital-heavy businesses can sometimes sustain levels between 3.0x and 5.0x [16]. The interest coverage ratio, on the other hand, shows if operating earnings are sufficient to cover interest payments. Ratios below 2.0x indicate potential challenges, while values near or below 1.0x point to severe financial strain. In 2024, the average interest coverage ratio for manufacturers was 0.32, reflecting widespread difficulty in managing debt obligations [5].
These benchmarks provide a clear lens for assessing financial health. Comparing your company’s ratios to these industry standards on a quarterly basis is critical, especially since manufacturing’s capital needs differ sharply from less capital-intensive industries [16][19]. This analysis can guide timely strategic adjustments.
To move forward, calculate your leverage ratios and measure them against these benchmarks. If your interest coverage ratio is below 2.0x or your debt-to-equity ratio surpasses 2.0x without a solid plan to reduce debt, it’s time to act [16][19]. Implement a structured monitoring system: review cash flows monthly, analyze leverage quarterly, and benchmark annually to stay ahead of financial challenges [19]. These ratios are not just numbers - they’re early warning signals that can help you avoid financial trouble.
"Financial ratios serve as your early warning system, alerting you to potential problems before they become crises and validating strategies that drive growth." – Venn [19]
For manufacturers with high operating leverage, advanced financial modeling and expert guidance are critical. Phoenix Strategy Group offers specialized support to help growth-focused manufacturers fine-tune their capital structure, monitor key leverage metrics, and make informed decisions about debt and equity. Their fractional CFO services and FP&A expertise are designed to help you balance growth, risk, and financial stability, ensuring long-term success.
When calculating the debt-to-equity ratio, it's best to focus on long-term debt. This approach zeroes in on leverage tied to interest-bearing obligations that extend over a longer period. By doing so, it provides a more accurate view of a company’s financial structure and its long-term commitments.
To determine the right leverage benchmark, it's important to look at industry standards and key financial ratios like the debt-to-equity ratio, debt ratio, and interest coverage ratio. These metrics help assess how your company stacks up in terms of financial health and risk.
You’ll also want to factor in your company’s growth stage, the asset intensity of your operations, and how sensitive your sector is to economic cycles. For instance, startups typically lean more on equity funding due to their higher risk profile, while established companies often take on more debt as they have stable cash flows to support it.
Comparing your metrics to the median ratios within your specific sub-sector is a practical way to ensure your leverage aligns with industry norms and promotes financial stability.
If your interest coverage ratio drops below 1.0x, it means your earnings aren’t enough to cover your interest expenses. This can be a red flag for financial trouble. To address this, work on increasing earnings or improving cash flow. You might need to cut unnecessary expenses, find ways to grow revenue, or even restructure your debt to get things back on track.