Published on
January 4, 2026


Customer journey mapping helps SaaS companies reduce customer acquisition costs (CAC) by identifying inefficiencies in the customer lifecycle - from awareness to retention. By visualizing every interaction, you can pinpoint where users drop off, refine touchpoints, and improve conversions. Here's what you need to know:
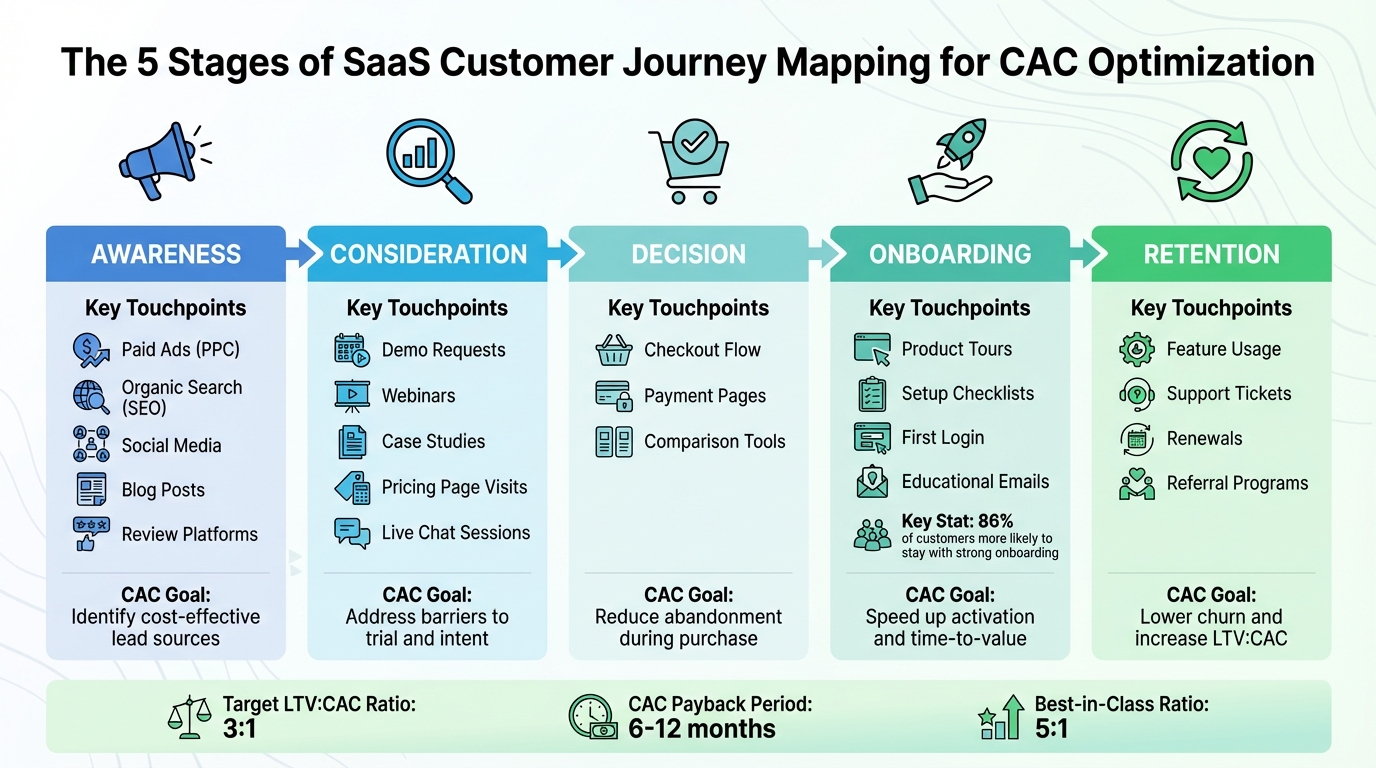
SaaS Customer Journey Mapping: 5 Stages to Optimize CAC
Breaking the customer journey into stages allows you to see exactly where potential customers drop off and where your acquisition budget can be put to better use. Every stage offers distinct opportunities to smooth out friction points and lower your overall Customer Acquisition Cost (CAC).
The awareness stage is where prospects first come across your product. The focus here is on identifying the channels that bring in high-quality leads at the lowest cost. Keep an eye on touchpoints like paid ads (PPC), organic search rankings, social media interactions, blog traffic, whitepaper downloads, and mentions on software review platforms like TrustRadius [1]. Tools for behavior analytics can help you tag trial users by their source, giving you a clearer picture of their journey through your funnel. These insights help you understand which channels are driving actual conversions and lay the groundwork for removing obstacles in the later stages.
In the consideration and decision stages, prospects are assessing if your product fits their needs. This is where actions like demo requests, webinar participation, case study views, visits to pricing pages, and live chat sessions become critical. Tools like session replays and heatmaps can help you spot friction points - like confusing navigation or unclear messaging - that cause users to abandon the process. Common hurdles include vague pricing, complicated checkout flows, or a lack of easily accessible comparison tools. Simplifying these areas, such as by offering clear pricing details and robust resources, can make the decision-making process much smoother.
For SaaS companies, acquisition doesn’t stop at the initial sale. The onboarding and retention phases are equally important. Track metrics like account registrations, first logins, product tours, setup checklist completions, and engagement with educational email campaigns. If churn rates are high, it’s a sign that customers may be leaving before you’ve recouped your acquisition costs, effectively raising your CAC. Research shows that 86% of customers are more likely to stick around when they experience strong onboarding and ongoing support [3]. Features like progress trackers and automated workflows can shorten the time it takes for users to see value in your product. By improving onboarding and retention, you not only reduce churn but also encourage customer advocacy - referrals that help lower your overall CAC.
| Journey Stage | Key Touchpoints to Track | CAC Optimization Goal |
|---|---|---|
| Awareness | Paid Ads, SEO, Social Media, Blog Posts | Identify cost-effective lead sources |
| Consideration | Demos, Case Studies, Pricing Pages | Address barriers to trial and intent |
| Decision | Checkout Flow, Payment Pages | Reduce abandonment during purchase |
| Onboarding | Product Tours, Setup Checklists | Speed up activation and time-to-value |
| Retention | Feature Usage, Support Tickets, Renewals | Lower churn and increase LTV:CAC |
A customer journey map helps pinpoint wasted spending and funnel drop-offs by combining insights from marketing, sales, product, and customer success teams into a clear sequence of customer interactions. These steps turn data into actionable strategies, aligning perfectly with efforts to optimize Customer Acquisition Cost (CAC).
Start by bringing together data from marketing, sales, product, and customer success. Each team offers a unique perspective: marketing tracks initial touchpoints that drive traffic, sales highlights what closes deals, product monitors user engagement, and customer success understands why customers churn. When these insights are combined, you get a complete picture instead of fragmented views [1].
Blend quantitative data with qualitative feedback to uncover drop-off points and user hesitations. Tools like Google Analytics can track traffic sources and identify where users leave your site. CRM platforms like HubSpot or Salesforce are great for monitoring lead activity, such as emails opened, meetings scheduled, and demo interactions. Product analytics can reveal where trial users struggle before upgrading to paid plans [1]. Tagging trial users to track when they first experience your product’s value can further refine your analysis [1].
But numbers only tell part of the story. Conduct interviews with your most valuable customers to uncover shared traits, common hesitations, and the time it takes them to see value [1][5]. Dive into support tickets and social media feedback to find usability issues that might not show up in analytics. A Customer Data Platform (CDP) can help unify all these insights into a single, cohesive view [2]. This comprehensive data collection is essential for identifying areas where CAC can be reduced.
If you want to optimize CAC, you need to know exactly who you're targeting. Most SaaS companies find that 3–5 detailed personas are enough to represent their audience segments [5]. Start by analyzing your most valuable customers - those with high lifetime value and low acquisition costs - and look for patterns [1].
Go beyond basic demographics when creating personas. Include firmographics like company size, industry, and revenue, as well as psychographics like pain points and events that trigger their search for a solution [5]. For B2B SaaS, identifying decision-makers is especially important. Their behind-the-scenes actions - consulting stakeholders, comparing reviews, and securing budget approvals - can significantly impact your sales cycle and CAC [7].
Each buyer persona should have its own journey map. Mapping them separately ensures you’re not wasting money on a one-size-fits-all strategy [7]. It also helps align your teams around a clear understanding of your "ideal" customer [1]. By tailoring your approach to each persona, every touchpoint becomes more relevant and effective.
Map out every interaction a prospect has with your brand. Organize these touchpoints into three categories: Marketing (ads, webinars, blog posts), Sales (demos, proposals, pricing pages), and Customer Success (onboarding emails, support tickets, knowledge base articles) [5].
Session replays can help you spot navigation issues like technical glitches or confusing UI elements that might drive users away. While aggregate data shows trends, session replays reveal the specific problems causing abandonment [1]. Look for bottlenecks and pain points in areas with high drop-off rates or negative feedback [1][5]. Common friction points include high bounce rates, complicated pricing, lengthy sign-up forms, and delays in delivering value during onboarding - all of which can inflate CAC.
Track both "Paid CAC" (ad spend divided by customers acquired from those ads) and "Blended CAC" (total acquisition costs divided by all new customers) to gauge the impact of organic referrals versus paid efforts [6]. Exit interviews with prospects who dropped out during the consideration stage can also uncover hidden issues that data alone might miss [2]. By thoroughly documenting these touchpoints and friction points, you’ll be better equipped to implement precise strategies to lower CAC.
Once you've mapped your customer acquisition journey and identified areas of friction, the next step is to monitor key metrics. These metrics help you pinpoint inefficiencies and guide strategies to lower your customer acquisition cost (CAC). They also reveal whether your acquisition efforts are running effectively. Let’s dive into some essential benchmarks to evaluate your performance.
The CLTV:CAC ratio measures the total value a customer brings over their lifetime compared to the cost of acquiring them. For SaaS businesses, a healthy target is a 3:1 ratio - each dollar spent on acquisition should ideally return three dollars in lifetime value [2][10]. A 1:1 ratio signals trouble, as it’s not financially sustainable. On the other hand, a ratio exceeding 4:1 could indicate you're underinvesting in growth and have room to scale customer acquisition efforts [12].
"If you have a ratio of better than 3:1, you have a customer acquisition engine that is performing well." - Geoff Roberts, Vice President of Marketing, Bizness Apps [10]
Leading SaaS companies often achieve ratios closer to 5:1 [11]. However, accuracy in calculating this metric is critical. Always include gross margin (revenue minus the cost of goods sold) in your calculations to get a clear view of profitability [9]. Ignoring gross margin might give you a false sense of efficiency, leading to poor decision-making.
In addition to ratios, timing metrics play a key role in assessing CAC performance.
The CAC payback period tells you how many months it takes to recover your acquisition costs from a single customer. Ideally, this should fall between 6 and 12 months. Faster recovery means you can reinvest in growth sooner, which is vital for maintaining momentum. However, high churn rates can disrupt this process [8][9].
For instance, if your payback period is 10 months but customers churn after 8 months, you’re essentially losing money on every acquisition [12]. During the COVID-19 pandemic, many SaaS companies reported a spike in new customer CAC payback periods to 2.4 years, while upsell and expansion efforts maintained a much healthier 1.0 year payback period [11]. This underscores the importance of retention and expansion revenue - selling to existing customers typically costs far less than acquiring new ones.
"Retention is the best and only check on whether your implied CAC payback will ever be realized CAC payback." - Sean Fanning, Vice President, OpenView [9]
Tracking these metrics by channel, customer segment, and acquisition strategy can help you identify where resources are being wasted. Companies using usage-based pricing models often enjoy a 30% shorter CAC payback period compared to those relying on traditional subscription models [9]. Additionally, SaaS companies with over $2.5 million in revenue typically allocate around 32% of their revenue to sales and marketing [10]. Comparing your spending to these benchmarks can help you determine if your investments align with industry norms.
Building on earlier journey mapping strategies, financial advisory services can sharpen your understanding of Customer Acquisition Cost (CAC) and improve how resources are allocated. Many SaaS companies miscalculate CAC by leaving out overhead expenses, confusing Cost Per Lead (CPL) with true CAC, overlooking sales cycle timing, or ignoring one-time costs like onboarding or setup fees [13]. Financial advisors step in to audit these calculations, ensuring every dollar spent on growth is accurately tracked. These audits also pave the way for more in-depth analyses, such as reviewing your revenue engine or forecasting cash flow.
In addition to correcting these errors, advisors often use segment profitability analysis to evaluate CAC and Customer Lifetime Value (LTV) by customer group. This method highlights which acquisition channels and customer segments yield the highest margins, enabling you to shift resources toward more effective strategies [13].
Revenue engine analysis helps benchmark metrics like Annual Recurring Revenue (ARR), Net Revenue Retention (NRR), and CAC against industry standards to identify areas needing improvement [13]. Advisors also focus on unit economics, like the LTV/CAC ratio and contribution margin, to determine if your pricing strategies and acquisition costs are sustainable for long-term growth. Investors tend to favor SaaS companies with strong unit economics and a clear route to profitability [13].
Phoenix Strategy Group, for instance, specializes in helping growth-stage SaaS companies analyze their revenue engines and address weak unit economics before scaling. Their process includes evaluating "fully burdened" rates, which account for servicing and capital costs, to ensure your acquisition strategy is financially sound. They also incorporate zero-based budgeting to identify hidden cost drains in marketing and software expenditures [13].
Accurate cash flow forecasting, informed by insights from unit economics, is essential for managing acquisition budgets effectively. Financial advisors often integrate real-time data from bank accounts and accounting systems into cash flow dashboards. This reduces the need for manual reconciliation and enhances the precision of spending forecasts [13]. As SaaS companies increasingly adopt AI-powered financial planning tools, these automated systems are becoming the norm [13].
Advisors also assist in creating standardized key performance indicators (KPIs) aligned with specific business objectives. By tying KPIs to different stages of the customer journey - such as Awareness, Acquisition, Adoption, Renewal, Expansion, and Advocacy - you can better measure how acquisition spending influences customer behavior [2].
Financial Planning and Analysis (FP&A) tools enable real-time tracking of CAC through automated dashboards, which monitor payback periods and provide insights into how quickly acquisition investments are recouped [13]. For example, a CAC payback dashboard can pull data from your CRM and accounting systems to identify which customer cohorts are becoming profitable the fastest.
These FP&A tools integrate data from multiple sources, including CRM, accounting, and Customer Data Platforms (CDPs), to track CAC payback in real time. This allows for immediate adjustments to optimize acquisition spending [2][13]. Additionally, cohort-based tracking of CAC and retention offers insights into product-market fit and highlights customer segments with the quickest payback periods [13]. By leveraging these tools, SaaS companies can ensure that improvements identified in their customer journey maps lead to lasting reductions in CAC.
Customer journey mapping gives you a clear view of where potential customers drop off and where your acquisition budget isn’t delivering results. By identifying problem areas - whether it’s a confusing pricing page, a clunky onboarding process, or challenges during a trial - you can focus on fixes that directly boost conversion rates. This approach works because it’s based on real insights from the customer experience, allowing you to address specific pain points instead of guessing.
Armed with this data, you can also make smarter decisions about where to allocate your marketing dollars. The Pareto Principle applies here: 80% of your best customers typically come from 20% of your efforts [4]. Journey mapping highlights which channels bring in the most qualified leads, helping you redirect funds from underperforming paid ads to more effective options like SEO or referral programs. Considering that nearly 89% of SaaS businesses prioritize acquiring new customers [4], knowing where to invest is crucial for sustainable growth.
Another big win? Improved onboarding can dramatically shorten your CAC payback period. Research shows that 86% of customers are more likely to stay loyal when they receive proper onboarding and education [3]. Helping users quickly reach that “aha moment” not only protects your acquisition spend but also improves your LTV:CAC ratio, aiming for the ideal 3:1 benchmark investors love [4].
Here’s how SaaS founders can use journey mapping to cut CAC effectively:
"The key is to never lose sight of the core parameters of customer acquisition and ensure the LTV:CAC ratio is at par or slightly above the industry benchmark." – Andres Muñoz, Marketing Manager at NachoNacho [4]
For SaaS founders looking to scale efficiently, combining journey mapping with financial advisory services like those from Phoenix Strategy Group can help you track CAC in real time and optimize unit economics. This creates a scalable, cost-effective acquisition engine that drives long-term growth.
Customer journey mapping is a powerful tool for spotting where potential customers might face obstacles or where touchpoints might not align as they should. By tackling these problem areas, you can fine-tune acquisition channels, make onboarding smoother, and put your energy into the interactions that matter most. This approach not only helps cut down on wasted marketing dollars but also lowers the cost of turning prospects into paying customers.
On top of that, mapping the journey uncovers ways to enhance user experience and boost retention. It ensures your marketing and sales efforts hit the mark, focusing on what truly resonates with your audience. By zeroing in on what your customers value most, you can drive steady growth while keeping your customer acquisition costs in check.
To make the most out of optimizing your CAC in SaaS, you need to keep an eye on a few key metrics that reveal how efficiently you're acquiring customers and the potential for long-term growth. Start by tracking CAC itself, along with the CAC payback period. This metric, calculated as CAC ÷ (MRR × gross margin %), shows how long it takes to recoup your acquisition costs. Another critical number to watch is the LTV-to-CAC ratio, which gives insight into the profitability of your customers over time.
Beyond these, other important metrics include monthly recurring revenue (MRR), gross margin percentages, conversion rates, time-to-first-value, churn rate, and lead growth rate. Together, these figures paint a comprehensive picture of your customer acquisition strategy, helping you pinpoint areas that need attention and ensuring you're on the path to sustainable growth.
The CLTV-to-CAC ratio is a critical metric for SaaS companies. It shows whether the revenue a customer brings in over their lifetime outweighs the cost of acquiring them. In simpler terms, it helps you understand if your sales and marketing efforts are paying off in a sustainable way.
When this ratio is strong, it signals that your customer acquisition strategies are working efficiently and that your business has solid long-term growth potential. This is especially important for attracting investors. For SaaS companies looking to scale, keeping a close eye on this ratio can help ensure you’re growing without compromising your financial stability.