Published on
June 1, 2026


Risk adjustment in value-based care ensures that payments align with patient health complexities, preventing providers from avoiding high-cost patients. By considering factors like demographics and chronic conditions, this process redistributes funds to support sicker populations. However, recent changes to CMS-HCC models, including the 2026 V28 rollout, are tightening coding rules, reducing eligible diagnoses, and reshaping financial outcomes for Medicare Advantage plans.
Key points:
To thrive, healthcare organizations must focus on accurate, encounter-based documentation, utilize predictive analytics, and update financial models to reflect new policies. Failure to adapt could lead to revenue losses and financial instability.
Risk adjustment isn't just a technical detail - it directly influences how funds are distributed across healthcare systems. For providers and plans working within value-based care models, the stakes are high. Accurate capture and reporting of patient risk can make or break financial outcomes. Let’s dive into how this process impacts payment accuracy, shared savings, and the financial performance of providers.
At its core, risk adjustment redistributes payments by allocating more to providers caring for sicker patients and less to those serving healthier populations. This ensures funding aligns with patient needs.
One key tool in this process is chart reviews, which help identify diagnoses that standard encounter data might miss. In 2023 alone, these reviews led to $24 billion in added Medicare Advantage payments [3]. In fact, 17% of Medicare Advantage enrollees in 2022 had a diagnosis added through chart reviews, boosting federal payments to their plans [3]. Certain conditions, like vascular disease and diabetes with chronic complications, each contributed over $1 billion to Medicare payments through these reviews [3].
The introduction of the CMS-HCC V28 model, rolling out between 2024 and 2026, is changing this landscape. While the number of Hierarchical Condition Categories (HCCs) increased from 86 to 115, the model removed around 2,100 ICD-10 codes that previously triggered payment uplifts [2]. This tighter coding framework reduces the number of diagnoses that can drive revenue, challenging plans and providers that relied on broad coding practices.
"To the extent V28 changes make it more difficult to realize economic upside from coding and documentation, plans and risk-based providers will need to focus on efficiently capturing the most high-impact diagnoses." - Doug Van Wie, Andrew Garibaldi, Max Stayman, and Penny Sun, L.E.K. Consulting [2]
These adjustments don’t just affect base payments - they ripple into shared savings and bonus incentives.
Risk scores don’t just determine payments - they also shape shared savings and bonus structures. When risk scores rise across a population, total payments increase. For example, in 2027, rising risk scores are expected to account for $13 billion - roughly half of the $26 billion in additional Medicare Advantage payments projected for that year [4].
However, stricter rules are coming into play. A new CMS policy excludes diagnoses from chart reviews unless they’re tied to a specific provider encounter. This change is expected to reduce average payments by 1.5% [4]. These tighter documentation requirements aim to narrow the gap between Medicare Advantage spending and traditional Medicare costs, which currently stands at 14%, or about $76 billion [4].
Not all providers are equally equipped to navigate risk adjustment. The ability to conduct detailed chart reviews has become a major financial advantage. Large insurers with advanced coding systems outperform smaller organizations in capturing diagnoses that boost risk scores.
Here’s how major insurers compare:
| Insurer | Share of Enrollees with Chart Review | Diagnoses Added | Diagnoses Removed |
|---|---|---|---|
| CVS Health | 86% | 19% | 0% |
| UnitedHealth Group | 77% | 23% | 1% |
| Centene Corporation | 73% | 26% | 0% |
| Humana Inc. | 34% | 9% | 1% |
| Kaiser Foundation Health Plan | 27% | 4% | 4% |
Source: KFF analysis of 2022 CMS Medicare Advantage encounter data [3].
The differences are striking. Centene added diagnoses for 26% of enrollees, removing almost none, while Kaiser Permanente added diagnoses for just 4% and removed the same percentage. This highlights the importance of advanced data systems and AI-assisted coding. Organizations with these tools can better adapt to the stricter V28 model, while those with less sophisticated setups may struggle to maintain their financial margins.
Current risk adjustment models come with financial risks for stakeholders, mainly due to aggressive coding practices, equity issues in patient populations, and documentation problems. These challenges disrupt the goal of aligning payments with actual patient complexity.
Medicare Advantage (MA) plans often aggressively document diagnoses to increase risk scores and secure higher federal payments. This practice, known as coding intensity, results in MA plans reporting significantly more diagnoses compared to Traditional Medicare (TM).
In 2021, this "differential coding" led to an estimated $33 billion in inflated MA payments. UnitedHealth Group alone accounted for 42% of that total, translating to $13.9 billion in additional revenue. On average, their risk scores were 0.28 points higher than they would have been under TM coding practices [6]. Even with the Centers for Medicare & Medicaid Services (CMS) applying a coding intensity adjustment, MedPAC found that MA coding intensity was still 10.3% higher than TM by 2026 [8].
"Success in MA is still heavily influenced by how effectively a plan can translate enrollee characteristics into the highest-yield risk-adjusted payments, which is sometimes more an indicator of success than how effectively plans provide care." - Georgetown CHIR Medicare Policy Initiative [8]
This creates a "coding arms race", where financial success depends more on documentation expertise than on delivering quality care. Organizations without advanced coding tools are at a disadvantage.
Beyond these inflated coding practices, disparities in risk adjustment models further complicate the system.
The current risk adjustment model doesn’t equally account for all patient populations. MA plans tend to attract healthier individuals, while those with complex and costly health needs often stick with - or return to - Traditional Medicare [9]. This favorable selection contributes to MA overpayments, projected to surpass $1.2 trillion by 2035 [9].
The model segments risk adjustment into six subpopulations based on dual-eligibility and disability status, assigning different payment coefficients to each group. For example, providers serving more full-dual disabled patients face a 4.45-point gap compared to MA plans, the largest disparity among segments [7]. Proposed changes for 2027 could further shift payments, potentially increasing reimbursements for skin disease categories by $132 per member per year (PMPY) while reducing payments for lung and heart disease categories by $76 and $54 PMPY, respectively [10].
"The large negative impact on lung, heart, and other chronic diseases suggests that plans disproportionately serving beneficiaries with complex chronic illness would be disadvantaged relative to those with greater exposure to skin diagnoses." - Ezekiel J. Emanuel, MD, PhD, Penn LDI [10]
In addition to coding challenges, documentation issues also cause revenue losses. Risk adjustment models require chronic conditions to be re-documented annually - a process called recapture. Failing to re-document conditions leads to year-over-year Risk Adjustment Factor (RAF) leakage.
A 2026 OIG audit of one MA organization revealed that 252 out of 300 sampled enrollee-years lacked sufficient medical records to support the submitted diagnosis codes [12]. This small sample alone led to $828,010 in net overpayments, with total overpayments for the period estimated at $4.4 million [12]. Other errors, such as untransmitted encounters or diagnoses removed by coding edits, can prevent conditions from being factored into payments [11].
"The single most expensive failure in risk adjustment is documentation that names a condition but doesn't prove it's active and relevant." - Safwan Azeem [11]
In Traditional Medicare, the problem takes a different shape. Physicians are not incentivized to record diagnoses, so chronic conditions often go undocumented in subsequent years, even if they remain active. This impersistent coding contributed to $8.1 billion in Medicare spending in 2020 [7].
The CMS-HCC V28 transition set for 2026 brings a major shift in documentation priorities. Under the older V24 model, the focus was on capturing the most severe version of a condition within a single disease family. However, V28 changes that game by assigning identical coefficients to related conditions, emphasizing breadth over depth. This means organizations must now document active conditions across multiple disease families instead of zeroing in on severity within just one.
That said, some categories - like Congestive Heart Failure (CHF), Chronic Kidney Disease (CKD), and Dementia - still benefit from detailed documentation. For instance, V28 introduces expanded dementia categories that require precise details, such as ejection fraction or acuity levels, to map conditions to the correct Hierarchical Condition Category (HCC).
One critical action step: Audit your EHR and analytics systems to ensure they’re updated for V28. The new model slashes the number of mapped ICD-10 codes from 9,797 (V24) to 7,770. Systems relying on outdated V24 crosswalks will fail to assign risk adjustment value to over 2,000 codes, leaving significant money on the table.
"The value has shifted from depth (severity within families) to breadth (conditions across families). Running V28 with V24 assumptions will systematically underperform." - Chin Ramamoorthi, Risk Adjustment Domain Expert [13]
Traditional coding methods often miss payment gaps, but predictive analytics is helping close those gaps. Prospective risk adjustment models, which rely on prior-year data, tend to underpay for patients with newly diagnosed chronic conditions. Predictive models, on the other hand, can identify early signs of disease before an official diagnosis is made, enabling organizations to address potential underpayments more effectively [1].
Another approach gaining traction is survey-based risk adjustment. For example, a 12-question self-reported health survey demonstrated an R-squared of 14% at the member level - slightly less than the 20% achieved by complex HCC-based models. However, at the health plan level, the simpler survey often outperformed the more intricate model in terms of payment accuracy [14]. For smaller organizations dealing with high administrative workloads, this trade-off is worth considering.
"As long as health care claim data drive risk adjustment, incentives will favor measuring differential data quality rather than the actual health status of members. This undermines the purpose of risk adjustment." - Syed Muzayan Mehmud, Principal, Wakely Consulting Group [14]
Incorporating these advanced methods can significantly improve revenue forecasting and financial outcomes.
Improved data capture and predictive methods are transforming risk adjustment into a vital tool for financial planning. Accurate documentation of risk factors doesn’t just improve coding - it directly impacts revenue models. For example, a 0.1 improvement in Risk Adjustment Factor (RAF) scores can translate to roughly $133 per member per year (PMPY) for every 1,000 members [15]. For a Medicare Advantage portfolio of 50,000 members, failing to account for the CMS normalization factor could lead to an overstatement of future revenue by 3% to 8%, equating to $20 million to $50 million in phantom revenue over three years [15].
Building financial models at the member-county level instead of relying on portfolio-wide averages can eliminate errors caused by Jensen's inequality. This statistical issue arises when averaging across nonlinear distributions, leading to biased projections. Organizations should also model nonlinear payoff structures - such as downside corridors, stop-loss thresholds, and risk fund mechanics - to ensure more accurate financial forecasting.
This is where firms like Phoenix Strategy Group come into play. Their financial planning and analysis (FP&A) systems help organizations stress-test revenue forecasts by modeling variables like RAF score variance (±0.05 to 0.10), benchmark rate changes (1% to 3%), and normalization factor increases (0.5% to 2.0%) [15]. These tools turn risk adjustment data into a powerful asset for board-level financial decision-making, rather than an afterthought.
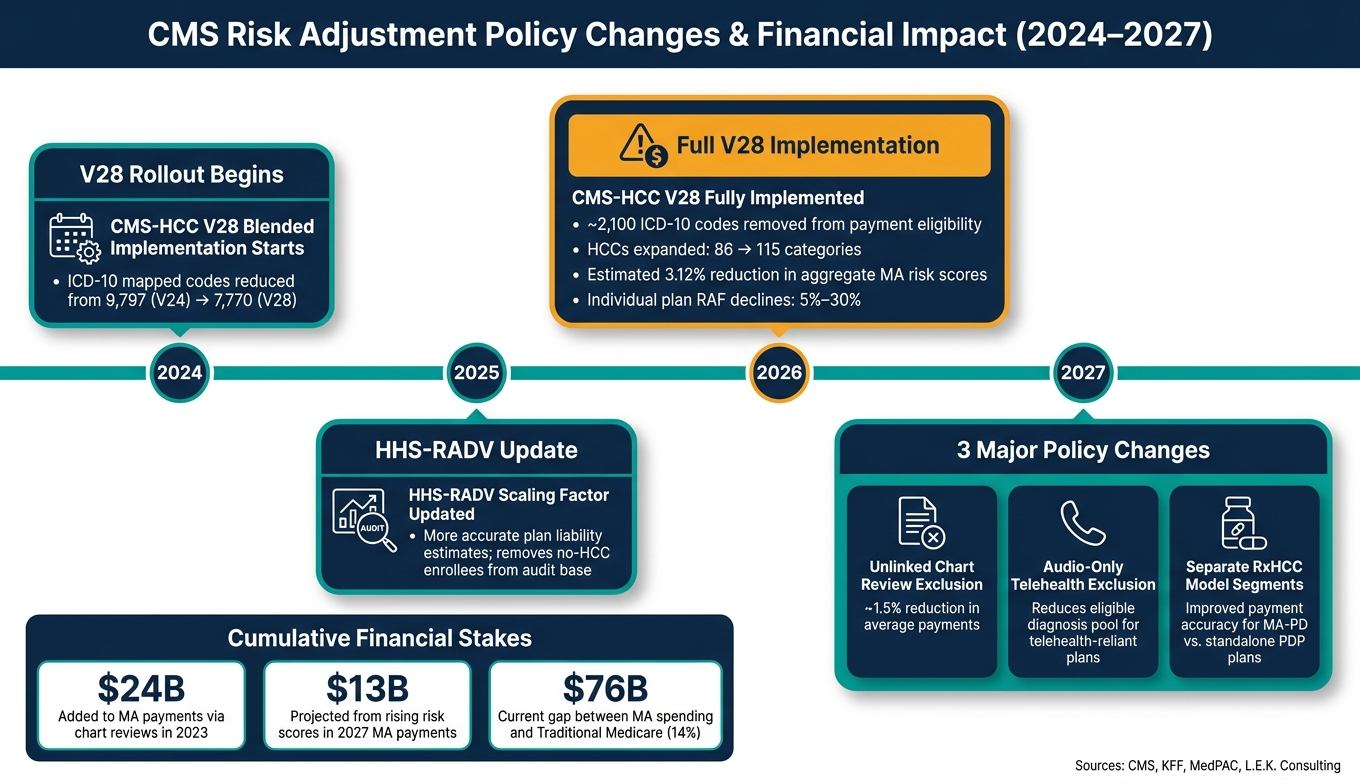
CMS Risk Adjustment Policy Changes & Financial Impact 2024–2027
In 2026, CMS will fully implement the CMS-HCC V28 model, marking the end of the previously blended approach. From this point forward, all Medicare Advantage risk scores will be calculated using V28. CMS estimates this shift will lead to an overall 3.12% reduction in MA risk scores. However, individual plans could see RAF declines ranging from 5% to 30%, depending on their population mix and historical coding practices [13].
Looking ahead to 2027, two additional policy changes are expected to further impact revenue projections. First, CMS plans to introduce separate RxHCC model segments for MA-PD and standalone PDP plans, aiming to improve the accuracy of drug cost predictions [17]. Second, risk scores will no longer include diagnoses from unlinked chart reviews - those not tied to specific provider encounters - resulting in an estimated 1.5% reduction in average payments [4]. Similarly, diagnoses made via audio-only telehealth will also be excluded [19]. These updates highlight the need for ongoing evaluation of their effects, especially on growth-stage healthcare organizations.
"By strengthening payment accuracy and modernizing risk adjustment, CMS is helping ensure beneficiaries continue to have affordable plan choices and reliable benefits, while protecting taxpayers from unnecessary spending that is not oriented towards addressing real health needs." - Dr. Mehmet Oz, CMS Administrator [5]
Here's a summary of the key policy changes and their financial implications:
| Policy Change | Effective Year | Financial Impact |
|---|---|---|
| Full V28 Implementation | 2026 | RAF declines of 5%–30% by plan [13][16] |
| Unlinked Chart Review Exclusion | 2027 | ~1.5% reduction in average payments [4] |
| Audio-Only Diagnosis Exclusion | 2027 | Reduces eligible diagnosis pool for telehealth-reliant plans [19] |
| Separate RxHCC Model Segments | 2027 | Improved payment accuracy for MA-PD vs. PDP plans [17] |
| HHS-RADV Scaling Factor Update | 2025 benefit year | More accurate plan liability estimates after removing no-HCC enrollees [18] |
These policy shifts have brought attention to unresolved issues in the current system. One major challenge is the prospective lag problem: risk adjustment models use prior-year data to set payments, which means plans face financial losses when a patient is newly diagnosed with a chronic condition. The resulting higher costs aren't accounted for until the following year [1]. This misalignment is further complicated by Fee-For-Service (FFS) spending shocks, such as the dramatic rise in skin substitute billing. Between 2019 and 2024, FFS Medicare spending on skin substitutes skyrocketed from $256 million to over $10 billion, driven largely by billing abuses. Without correction, this could have shifted $3 billion in MA payments to beneficiaries with unrelated skin diagnoses [10].
Many experts are advocating for a departure from the current HCC framework. For example:
"CMS should also move beyond the decades-old HCC framework and modernize its risk adjustment approach... adopting modern analytic methods, including machine learning and AI." - Ezekiel J. Emanuel, MD, PhD, University Professor, Perelman School of Medicine [10]
"Model updates are not merely statistical tinkering - they are policy decisions with predictable behavioral consequences." - Ezekiel J. Emanuel, MD, PhD, University Professor, Perelman School of Medicine [10]
For growth-stage healthcare organizations, these policy changes translate into direct impacts on cash flow, budgeting, and M&A valuations. Revenue models based on older assumptions, like V24 coefficients or retrospective chart review practices, are no longer reliable. Without updating financial models to align with V28 and the 2027 exclusion rules, companies risk overestimating future revenue [13][16].
Operationally, organizations must shift their focus from end-of-year coding reviews to real-time, encounter-based documentation. According to Marcos Dachary and Rick Gordon of MedInsight: "The old playbook for managing risk no longer works. Organizations must adapt, because the rules will continue to evolve." [16]
This is where robust financial planning becomes essential. Firms like Phoenix Strategy Group specialize in helping healthcare companies adjust their revenue forecasting models to reflect these regulatory changes. They stress-test assumptions on RAF score adjustments, normalization factors, and the downstream effects of coding policy updates on M&A valuations. In a market where even a 1.5% payment reduction or a 5%–30% RAF decline can significantly alter enterprise value, having accurate, policy-informed financial models is no longer optional - it’s a competitive edge.
Risk adjustment plays a central role in shaping revenue, profit margins, and long-term financial stability within value-based care. With the CMS-HCC V28 model set for full implementation in 2026, more than 2,000 diagnosis codes will be removed, leading to an estimated 3.12% reduction in aggregate Medicare Advantage risk scores [13].
The financial implications of these changes are already being felt. In April 2025, UnitedHealth Group revised its full-year adjusted EPS forecast from $29.50–$30.00 to $26.00–$26.50, attributing the adjustment to higher-than-expected Medicare Advantage utilization and the coding intensity reset under V28. This shift is expected to impact the company’s operating income by $5 billion to $6 billion [20]. These developments highlight a critical shift: traditional retrospective coding strategies are no longer sufficient. Financial success now relies on documenting conditions across multiple disease categories rather than focusing solely on the most severe codes. As Rick Gordon of MedInsight aptly stated:
"Earlier, accurate documentation now matters more than end-of-year cleanup." [16]
Looking ahead, upcoming policy changes will further reshape payment structures. In 2027, the exclusion of unlinked chart reviews and audio-only telehealth diagnoses from eligible payments will tighten requirements even further. Organizations that fail to modernize their revenue models risk serious financial consequences. To stay competitive, tools like encounter-based documentation, AI-powered coding, and integrated risk–quality workflows are becoming non-negotiable.
For healthcare organizations, adapting to these changes requires proactive financial planning. Growth-stage companies, in particular, must treat risk adjustment as a core element of their financial strategy. Firms such as Phoenix Strategy Group specialize in helping organizations stress-test their revenue models against evolving policies. By integrating updates to RAF assumptions, normalization factors, and coding practices into their financial forecasts, these companies can better prepare for policy-driven disruptions and ensure accurate valuations for mergers and acquisitions.
Starting January 1, 2026, the CMS-HCC V28 model will introduce changes that are likely to impact Risk Adjustment Factor (RAF) scores and revenue. Specifically, revenue is projected to decrease by about 3.12%. This shift stems from the removal of more than 2,000 ICD-10 codes and the application of standardized coefficients to related conditions. The result? Reimbursement for severe cases will be more restricted.
To address these changes, organizations need to prioritize accurate, encounter-based documentation. Relying on retrospective chart reviews will no longer be enough to maintain revenue stability. Instead, a proactive approach to capturing detailed and precise documentation during patient encounters will be key to mitigating potential financial losses.
In 2027, diagnoses connected to accepted beneficiary encounters - like inpatient stays, outpatient hospital visits, or professional services - will be considered for risk adjustment. For this to apply, the encounter must include a risk-adjustment-eligible CPT or HCPCS code and involve a face-to-face interaction. Diagnoses from sources like unlinked chart reviews or audio-only telehealth services won't qualify for risk adjustment.
Smaller healthcare groups can take meaningful steps to reduce Risk Adjustment Factor (RAF) leakage by adopting a more integrated approach that brings clinical, financial, and operational teams onto the same page. Here are some practical strategies:
By aligning these efforts, smaller groups can better manage RAF leakage and strengthen their overall risk adjustment processes.