Published on
June 1, 2026


Understanding CAC and LTV is non-negotiable for CPG startups looking to scale profitably. These metrics reveal whether you're spending more to acquire customers than they're worth, helping you avoid the common pitfalls that lead to financial instability. Many brands leverage fractional CFO services to navigate these complex unit economics.
Key Takeaways:
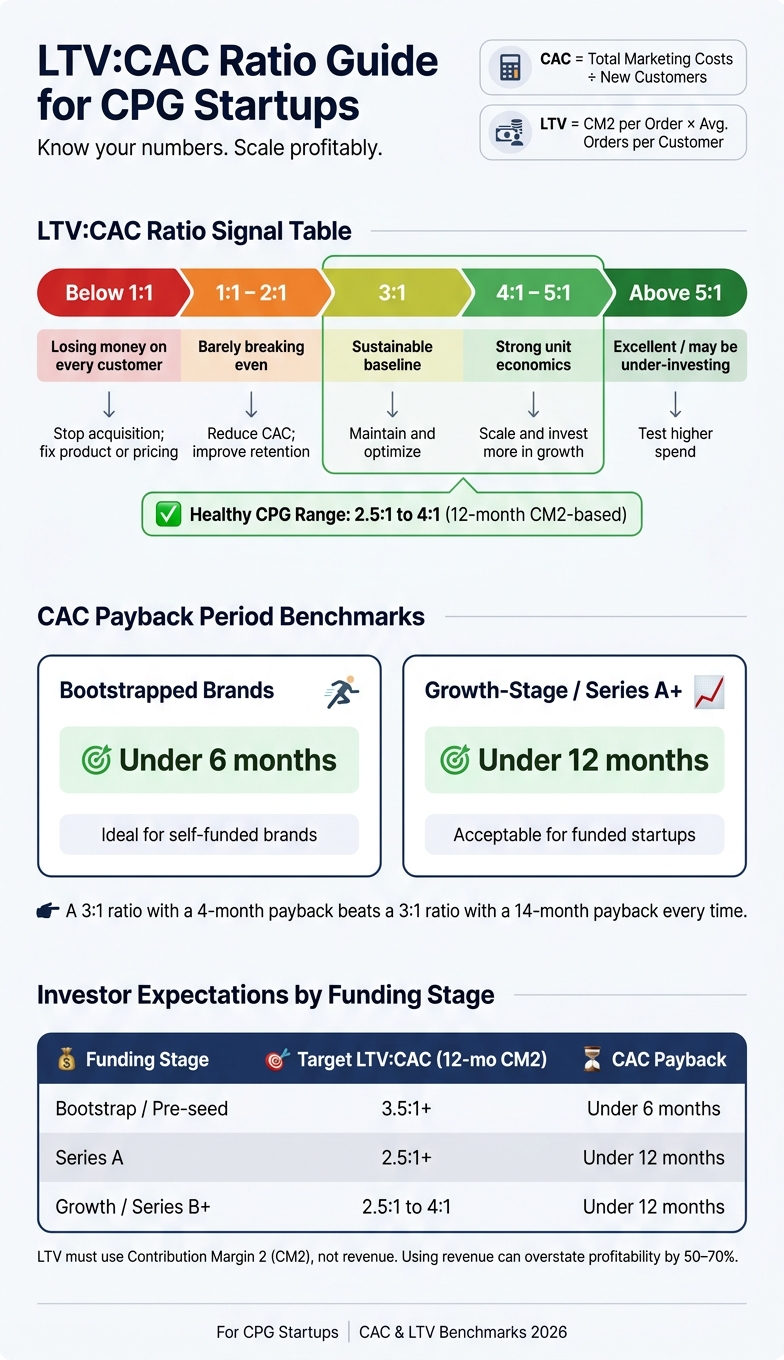
LTV:CAC Ratio Guide for CPG Startups: Benchmarks & Actions
Customer Acquisition Cost (CAC) refers to the total cost of acquiring a single new customer. To calculate it, divide your total sales and marketing expenses by the number of new customers gained during a specific period.
To get an accurate CAC, include all related expenses - like agency fees, creative production, and marketing team salaries. Missing these could underreport CAC by as much as 15–25% [7]. It's also helpful to distinguish between two types of CAC:
Blended CAC gives a more comprehensive picture of your business’s overall health.
Lifetime Value (LTV) measures the total profit a customer generates for your brand, focusing on contribution margin rather than just revenue.
For CPG brands, this is particularly important because their per-order costs - like COGS, shipping, and returns - are much higher than those in SaaS. Using revenue instead of contribution margin (CM2) can overestimate profitability by as much as 50–70% [4].
"The fastest way to break a DTC brand is to scale paid spend without knowing your contribution margin to the dollar. We've audited brands spending $50K/month on Meta that didn't know they were losing $4 on every order." - Top Growth Marketing [3]
Unlike SaaS businesses, where revenue is often recurring, CPG brands typically see transactional revenue that decreases over time. This makes it more reliable to calculate LTV within a specific time frame, like 12 or 24 months, rather than projecting it indefinitely. Predictive accuracy drops significantly beyond two years [4].
These definitions highlight why CAC and LTV are critical for assessing financial sustainability in CPG businesses.
Mastering these metrics is essential for sound financial planning and accurate decision-making - both of which are covered in more detail later in this guide.
One of the most important tools for evaluating your business model is the LTV:CAC ratio. This ratio helps determine whether your customer acquisition efforts are bringing in more value than they cost. It’s also a key metric for investors, as it reflects how efficiently your business uses capital.
An ideal LTV:CAC ratio is 3:1, with most scaling CPG brands falling between 2.5:1 and 4:1 [4][6]. Here’s a breakdown of what different ratios signal:
| LTV:CAC Ratio | What It Signals | Suggested Action |
|---|---|---|
| Below 1:1 | Losing money on every customer | Stop acquisition; fix product or pricing |
| 1:1 to 2:1 | Barely breaking even | Reduce CAC; improve retention |
| 3:1 | Sustainable baseline | Maintain and optimize |
| 4:1 to 5:1 | Strong unit economics | Scale and invest more in growth |
| Above 5:1 | Excellent | Test higher spend; may be under-investing |
Source: [5]
Investors also pay close attention to the CAC payback period, which is how long it takes to recover the cost of acquiring a customer. For example, a 3:1 ratio with a 4-month payback is far more appealing than the same ratio with a 14-month payback. Faster recovery means you can reinvest funds into customer acquisition more quickly [4]. For most CPG startups, a payback period under 12 months is acceptable, while under 6 months is ideal.
Understanding how to calculate Customer Acquisition Cost (CAC) is crucial for CPG startups aiming to manage their budgets effectively. Here's a step-by-step guide to help you determine it accurately.
Start by defining the time frame for your analysis. Most early-stage CPG brands use a monthly window, but if your ad spend exceeds $50,000 per month, a weekly breakdown might make more sense [1].
Focus only on new customers. This means excluding returning buyers or reactivated customers from your calculations. If you're selling through multiple channels, separate your direct-to-consumer (DTC) data from retail sales. Retailers acquire their own customers, so mixing wholesale data with DTC metrics can lead to inaccurate results [1].
Once your time frame and customer type are clear, it's time to identify all relevant costs.
CAC isn't just about ad spend. Many brands underestimate their true acquisition costs, leading to significant miscalculations. Since 2021, blended CAC has increased by 40–60%, partly because brands fail to account for all acquisition-related expenses [1]. Here's what you should include:
What to exclude? Costs like email or SMS campaigns targeting existing customers, loyalty program expenses, product development, and general overhead. These belong in retention or operating expense categories rather than CAC [10][11].
The formula for CAC is straightforward:
CAC = Total Sales & Marketing Costs ÷ New Customers Acquired
Make sure your inputs are accurate and aligned with your selected time period. For example, if you spend $18,000 in April and acquire 200 new customers, your CAC would be $90.
To refine your analysis, break down costs by individual channels. This allows you to pinpoint which platforms - such as Meta, Google, or TikTok - are delivering the best results. A blended average can sometimes hide inefficiencies, so channel-specific insights are invaluable.
"Revenue growth hides a lot of sins. You can 10x revenue while destroying profitability - buying customers for more than they're worth." - Niblin [11]
For reference, here are the 2026 median blended CAC benchmarks by vertical:
| Vertical | Median Blended CAC |
|---|---|
| Food & Beverage | $53 – $100 |
| Supplements | $60 – $110 |
| Pet Care | $68 – $90 |
| Apparel | $90 – $120 |
| Beauty & Personal Care | $90 – $130 |
Source: [1]
Lastly, align your spending with the typical 7–14 day consideration window [7]. If you mismatch high ad spend with a low-conversion period, your CAC may appear inflated, even if it's not indicative of long-term performance.
Once you’ve nailed down a reliable CAC figure, the next step is to compare it with your LTV. But calculating LTV accurately is crucial - getting it wrong can lead to some costly mistakes.
One common pitfall for CPG founders is overstating customer profitability by focusing on revenue instead of profit. In fact, using revenue instead of profit can inflate profitability estimates by 40–60% on a typical DTC profit and loss statement [4]. The right way to approach this is by calculating Contribution Margin 2 (CM2), which accounts for all variable costs deducted from net revenue.
Here’s a breakdown of the margin layers:
| Margin Layer | Formula | What It Tells You |
|---|---|---|
| CM1 | Net Revenue − Landed COGS | Evaluates product costs and pricing feasibility [12] |
| CM2 | CM1 − Fulfillment − Shipping − Transaction Fees | Reflects the margin left to cover CAC and other overhead expenses [12] |
| CM3 | CM2 − CAC | Indicates if a first order is profitable on its own [12] |
For example, let’s say you sell a 12 oz. bag of coffee for $22.00. After subtracting all variable costs, you’re left with a unit contribution margin of $6.36 [17]. That $6.36 - not the $22.00 sale price - is the number you’ll use to calculate LTV.
"The fastest way to break a DTC brand is to scale paid spend without knowing your contribution margin to the dollar." - Top Growth Marketing [3]
Once you’ve nailed down the CM2, the next step is to evaluate customer purchase behavior to complete the LTV calculation.
With CM2 per order in hand, the next piece of the puzzle is understanding how customers actually buy. This means analyzing purchase frequency and retention through cohort analysis. By grouping customers based on the month they made their first purchase, you can track their behavior over time and avoid misleading averages that might hide weak performance among newer acquisition cohorts [1][8].
Pay close attention to two key metrics:
For context, the average 12-month repeat purchase rate for DTC brands is 28.2% [13]. If your brand achieves a 40%+ repeat rate by month six, you’re in a strong position. Brands hitting this benchmark have a 72% chance of scaling profitably, compared to just 15% for brands with sub-30% repeat rates [1].
With CM2 and purchase behavior metrics in place, you can calculate LTV using this formula:
LTV = CM2 per Order × Average Number of Orders per Customer
This calculation is a powerful tool for evaluating your CAC and determining whether your growth strategy is sustainable.
When making acquisition decisions, stick to a 12-month window [4] to avoid overly optimistic projections that could lead to reckless spending. For subscription-based models - like those in supplements or pet care - a 24-month window can work better since churn patterns are more predictable [4]. On the other hand, food and beverage brands with frequent purchases but thinner margins might find a 60-day LTV window more practical for managing CAC within a given quarter [3].
"If you need a five year horizon to make the ratio work, you have a financing problem—one that a fractional CFO can help solve—not an economics one." - Shopappy [14]
Once you've calculated your CAC (Customer Acquisition Cost) and LTV (Lifetime Value), the next step is figuring out how to use these numbers to grow your business effectively.
With both CAC and LTV in hand, divide your LTV by your CAC to get the LTV:CAC ratio. A ratio of 3:1 is often cited as the minimum benchmark for sustainable growth in direct-to-consumer (DTC) businesses. If your ratio dips below 2:1, it’s usually a sign that your acquisition model isn’t working [1]. Keep in mind, though, that this "3:1 rule" originates from SaaS companies and doesn’t always apply to other industries. For instance, consumer packaged goods (CPG) companies often aim for a 12-month Contribution Margin 2 (CM2) ratio between 2.5:1 and 4:1 [4].
"The '3:1 rule' gets quoted in every pitch deck... but it comes from SaaS... and applies poorly to a transactional business with a 12-month repeat curve." - Matt Putra, Managing Partner, Eightx [4]
It’s also essential to pair the LTV:CAC ratio with your CAC payback period. Even if you hit a 3:1 ratio, a payback period of over 14 months can create cash flow problems, especially for startups. For bootstrapped businesses, a payback period of under 6 months is often critical to stay self-sufficient [4].
Once you’ve nailed down the ratio, dive deeper into how it varies across channels and customer segments.
A blended LTV:CAC ratio can be misleading because it averages performance across all acquisition channels. For example, a blended 3.8:1 ratio might seem strong but could hide inefficiencies like a Meta campaign running at 2.4:1, while Google branded search delivers a much healthier 9:1 [13]. To make informed decisions, you need channel-specific data.
Here’s a breakdown of typical CAC ranges and characteristics by channel:
| Channel | Typical CAC Range | Key Characteristic |
|---|---|---|
| Meta (FB/IG) | $28–$95 | High scale; creative quality drives results [4] |
| Google Search | $18–$70 | High intent; branded search is most cost-effective [4] |
| TikTok | $22–$80 | Lower CAC than Meta; prone to attribution errors [4][1] |
| Email/SMS | $3–$15 | Highest LTV; more about retention than acquisition [4] |
| Organic/Referral | Low/Amortized | Delivers 40–60% higher repeat rates than paid social [13] |
Organic and referral channels often deliver LTV:CAC ratios between 5:1 and 7:1, but scaling them can be tricky. Paid social, while easier to scale, typically operates at ratios 30–50% lower [13]. A smart strategy is to shift budget away from underperforming channels (those below 2:1) and toward channels that maintain ratios between 3:1 and 5:1 [1][3].
Also, don’t just rely on platform-reported CAC numbers. Platforms like Meta and TikTok often overstate their impact by 30–60%. Validate their data with post-purchase surveys [1][2].
"A ratio above 5:1 signals underinvestment in acquisition rather than exceptional performance... there is typically room to increase paid acquisition spend profitably at these ratios." - Abhi Agnihotri, Founder & CEO, AdZeta [13]
With detailed insights by channel and segment, you can tie these metrics into your broader financial framework.
To make the most of your CAC and LTV calculations, incorporate them into your financial planning. Use a 60-day LTV window for short-term spending limits and a 12-month LTV window for longer-term planning and investor discussions [3]. Anything beyond 12 months should be treated as a bonus, not a guarantee.
These metrics are particularly useful for investor presentations, as they highlight strong unit economics. Here’s what investors typically expect at different funding stages:
| Funding Stage | Target LTV:CAC (12-mo CM2) | Target CAC Payback |
|---|---|---|
| Bootstrap / Pre-seed | 3.5:1+ | Under 6 months [4] |
| Series A | 2.5:1+ | Under 12 months [4] |
| Growth / Series B+ | 2.5:1 to 4:1 | Under 12 months [4] |
For founders, working with a financial consultant or fractional CFO can make a big difference. Firms like Phoenix Strategy Group specialize in helping startups integrate CAC, LTV, and payback periods into their financial models. This ensures you’re prepared to present a clear, data-backed story about your unit economics and your path to achieving a 3:1+ ratio.
Here’s a summary to help refine your strategy based on the methods and benchmarks discussed.
CAC and LTV are essential metrics for long-term success. Always calculate LTV using CM2 (Contribution Margin 2), as basing it on revenue can overstate profitability by 50–70% [4].
"Revenue lies, unit economics reveal the real financial picture. A D2C brand can grow top-line revenue while destroying cash." - Siddharth Gangal, CEO, Fairview [1]
The LTV:CAC ratio is only meaningful if your data is accurate. Use blended CAC, align it with the correct LTV window, and double-check attribution beyond what platforms like Meta or TikTok report. For most CPG brands, a 12-month CM2-based LTV:CAC ratio of 2.5:1 to 4:1 is considered healthy [4]. Additionally, growth-stage companies should target payback periods under 12 months, while bootstrapped brands should aim for under 6 months.
Retention plays a big role in improving these metrics. For example, boosting repeat purchase rates by just 10% can increase your 12-month CM2-based LTV by 8–12% - a faster path to a better ratio than simply cutting acquisition costs [4]. Brands with a cohort repeat rate above 40% by month 6 are 72% more likely to scale profitably, compared to only 15% for those with rates below 30% [1].
Track metrics continuously using dual windows. Use a 60-day window for cash flow management and a 12-month window for strategic planning. This dual approach helps ensure your unit economics stay on track. Looking ahead, investors in 2026 are expected to focus on a 3.5:1+ LTV:CAC ratio and a 35% contribution margin as indicators of robust unit economics [1].
These principles, like those practiced by Phoenix Strategy Group, should guide not only your acquisition strategies but also your broader financial planning. By integrating these insights, you can refine your approach to growth and maintain a sustainable business model over time.
To figure out an accurate Customer Acquisition Cost (CAC) for your CPG brand, you need to account for all the expenses related to bringing in new paying customers. This includes costs like:
It's important not to limit your calculations to just ad spend. A comprehensive approach ensures you're setting your brand up for sustainable growth.
Calculating LTV (Lifetime Value) based on revenue alone can paint an overly rosy picture of customer profitability - sometimes overestimating it by a staggering 50% to 70%. Why? Because this approach skips over key variable costs like COGS (Cost of Goods Sold), shipping, payment fees, and returns. These costs significantly impact your bottom line.
That's where CM2 comes in. CM2, which is revenue minus these variable costs, offers a much more accurate view of the cash flow that's actually available to reinvest in growth. By basing LTV calculations on CM2 instead of revenue, you're working with real margins - not inflated numbers - allowing for smarter, more grounded decision-making.
The ideal LTV (Lifetime Value) window hinges on your financial objectives. If you're focusing on short-term cash flow or making ad-spend decisions, a 60-day LTV is a smart choice - it helps recover costs quickly. For broader strategic planning and evaluating long-term unit economics, a 12-month LTV is generally more effective. Though some businesses consider 24-month windows, the 12-month timeframe strikes a good balance, aligning sustainability with available capital.