Published on
June 1, 2026

FP&A is no longer just about numbers - it's about driving better decisions in commodities trading. Here's the key takeaway: mastering financial planning and analysis (FP&A) can help firms generate higher returns (alpha) by improving speed, integration, and decision-making precision.
The article highlights how FP&A tools and strategies can optimize forecasting, risk management, and capital allocation. These methods enable firms to adapt to volatile markets, protect profits, and allocate resources to high-return opportunities.
Key points include:
In a competitive market, firms that treat FP&A as a decision-making partner - rather than a back-office function - are better positioned to outperform.
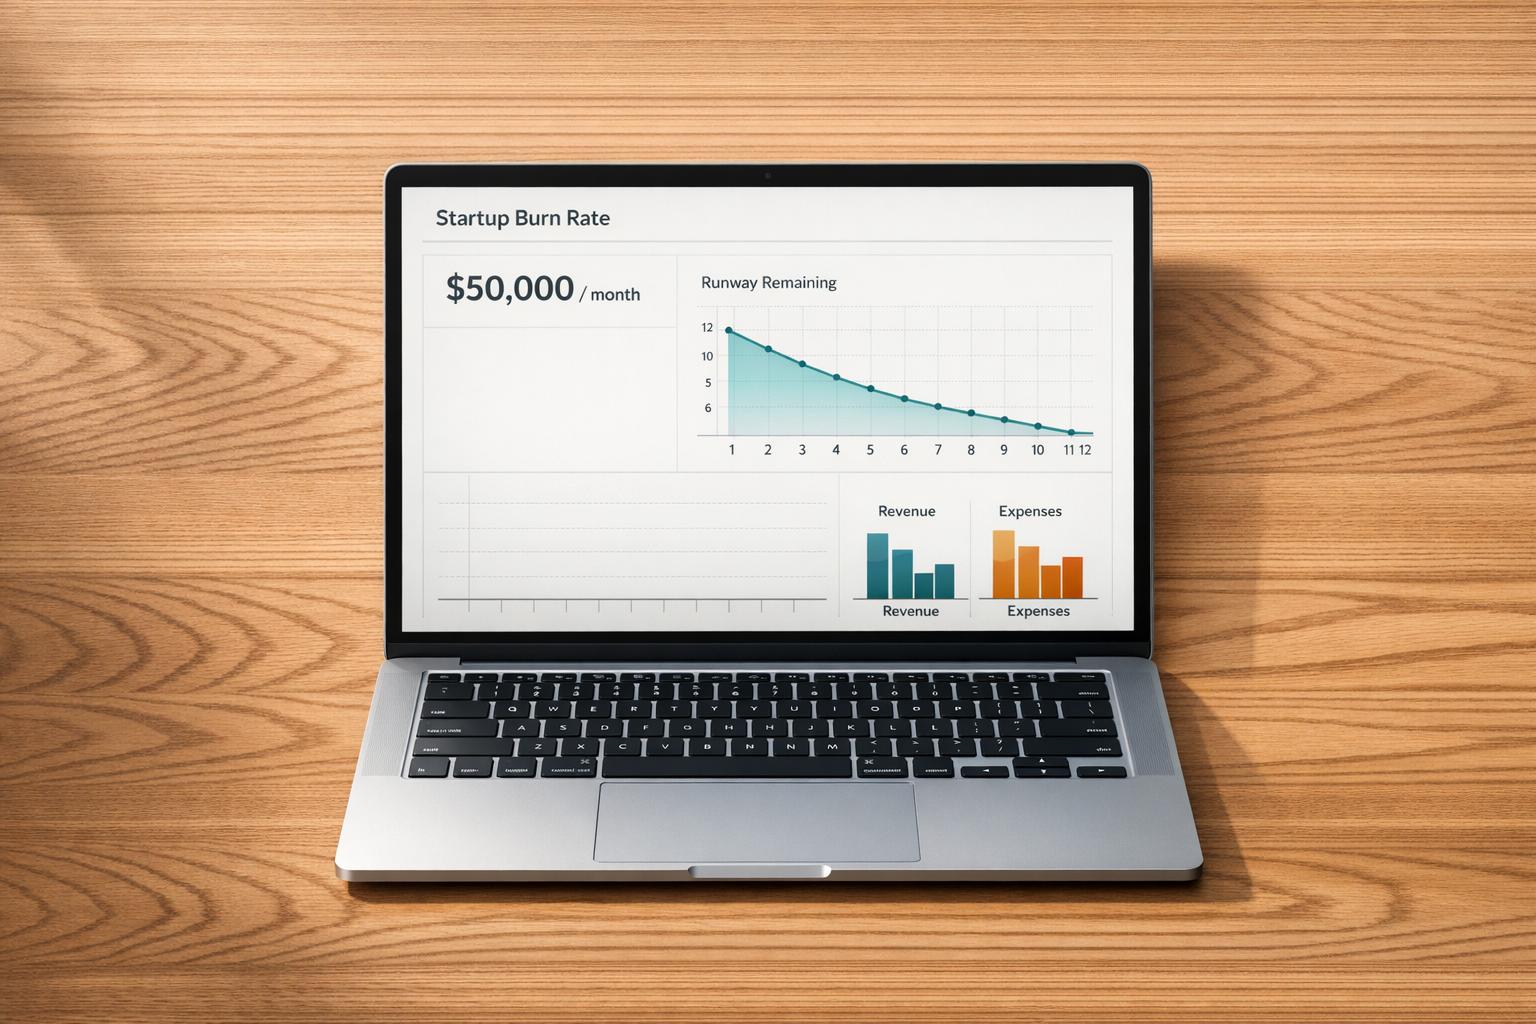
Traditional FP&A involves tasks like budgeting, rolling forecasts, variance analysis, and management reporting [5]. But in the fast-paced world of commodities trading, these processes must be more agile. Static annual budgets simply don’t work when crude oil inventory shifts of over 3 million barrels can cause futures prices to jump by 1.5–2.5% in just an hour [1].
Instead, the focus shifts to continuous planning, often relying on 12–18 month rolling forecasts that update as new market data becomes available [4]. However, fewer than 25% of finance teams achieve forecast accuracy within ±5% of actual results [3]. In a volatile trading environment, this margin of error can be the difference between seizing a profit opportunity and losing out entirely.
Mastering these FP&A processes is essential for understanding the economic dynamics that drive commodities trading.
FP&A tools in commodities trading need to reflect the unique factors that influence these markets. Unlike equity prices, which are often tied to earnings growth, commodity prices are shaped by physical supply constraints, inventory levels, demand cycles, and production costs [1]. A key analytical tool for this is the supply-demand balance sheet, which compares Beginning Stocks + Production + Imports to Domestic Consumption + Exports.
From this framework, two critical metrics emerge:
What really moves prices, though, are changes in these metrics - like shifting from surplus to deficit - rather than their absolute values [1].
Another challenge is basis risk, which arises from regional price differences, such as the WTI-Midland spread. These gaps can widen significantly when pipeline capacity is limited [1]. Ignoring basis risk can lead to unexpected losses, as a seemingly profitable position can be undermined by logistical bottlenecks. This makes it crucial to model basis risk as a standalone factor, not just an afterthought.
Managing separate files for positions, hedges, and financials creates what’s known as a "reconciliation tax", which eats up time that could be spent on decision-making [3]. The solution? A single, integrated model. With built-in scenario toggles (using tools like CHOOSE or INDEX/MATCH), this model should seamlessly connect to the P&L, balance sheet, and cash flow statement, enabling efficient scenario analysis and stress testing.
Price deck construction should include at least three scenarios:
Adding a bear case stress test helps the CFO identify when covenant thresholds might be at risk. A particularly useful method is reverse stress testing, which works backward from a potential debt covenant breach to pinpoint the exact price or volume level that would trigger it [3].
"The CFO's toolkit comprises forecast, sensitivity, scenario, and stress testing." - BPR Global [3]
Driver-based modeling further refines this process by breaking down performance into key components like volume, price, mix, and basis risk [4]. This approach helps traders identify the specific factors driving profitability, aligning FP&A efforts with the goal of generating strategic value. These techniques also play a critical role in measuring performance against market risks, setting the stage for deeper analysis in the sections that follow.
Before you can safeguard alpha, it's crucial to pinpoint its source. FP&A breaks down commodity P&L into three components: market moves (broad price trends influenced by macroeconomic forces), basis risk (regional price variations and logistics correlations), and carry (returns derived from the futures term structure) [6][11]. This breakdown helps distinguish true skill - alpha - from passive exposure to market beta.
Basis risk can quietly eat away at alpha even when the primary hedge seems effective. Keeping an eye on the correlations between product prices and local logistics costs is key [6]. Without this detailed analysis, a trader might appear profitable on paper while their position is silently undermined by widening spreads.
Once alpha is isolated through precise P&L attribution, the next step is assessing the risk tied to those returns. Raw P&L only tells part of the story. The real question is: how much risk was taken to achieve that return? The Sharpe ratio is a widely used tool to measure return per unit of risk, offering a way to compare the efficiency of different alpha strategies [2][11]. For strategies where negative volatility is a greater concern, the Sortino ratio provides a more targeted approach, focusing only on downside risk [11].
For leveraged positions, Margin at Risk (MaR) is a critical metric. It estimates the maximum cash outflow over 1–5 days at a 95% or 99% confidence level [12]. A good rule of thumb is to maintain a cash buffer of 10–20% above your MaR calculation to handle unexpected market shocks [12]. Volatility inputs should be refreshed weekly, and results cross-validated using both parametric and historical simulations [12].
"Numbers move markets, but discipline secures profit." - Uhedge [6]
Risk metrics are just the start. FP&A enhances preparedness by using scenario analysis and stress testing to anticipate and withstand market shocks. Scenario analysis creates multi-variable narratives, while stress testing focuses on extreme individual shocks [3]. Together, they address two critical questions: what’s likely? and what’s survivable?
Applying mild (5–10%), moderate (10–25%), and severe (25–50%) shocks helps capture short-term fluctuations, regional disruptions, or major supply chain failures [10]. Importantly, effective stress tests must account for correlated risks. For instance, a simultaneous commodity price crash and sharp currency devaluation can create a compounded effect that single-variable tests might miss [9]. Organizations that regularly run scenario analyses are 4.5x more likely to be prepared for systemic financial shocks [3].
"A company that runs three coherent scenarios every quarter is buying decision speed. A company that runs none is buying surprise." - BPR Global [3]
To protect realized alpha, robust liquidity management is essential. Gains on paper can evaporate quickly if a margin call can't be met in cash. Rolling cash flow forecasts - structured as 4+8 or 6+6 frameworks - help manage the cash conversion cycle in active trading environments [3][4]. These forecasts must account for inventory financing timelines, variation margin exposure, and settlement lags simultaneously.
The focus isn’t just on accuracy but also on speed of response. By linking KPI dashboards to pre-approved action plans - where a "Red" trigger might automatically initiate a credit line draw or pause capital expenditures - companies can act swiftly during market fluctuations [3].

FP&A Governance Maturity Stages in Commodities Trading
While managing liquidity is crucial, strong governance is what drives long-term growth. FP&A's role goes beyond just crunching numbers - it actively shapes the environment where trading strategies are created, tested, and funded.
Before any capital is committed to a new trading strategy, FP&A teams need to rigorously test its logic. One effective method is wind tunneling, which involves running strategies through various scenarios to assess their strengths and weaknesses [3]. Another tool often used is tornado diagram analysis, which identifies the top 5–8 variables that most impact EBITDA or free cash flow. These variables then become the focus for scenario modeling. The goal? To create a single, flexible model with built-in scenario toggles, avoiding the inefficiencies of juggling multiple spreadsheets [3].
"Scenarios are not about predicting the future. They are about perceiving futures in the present." - Pierre Wack, former head of Group Planning, Royal Dutch Shell [3]
Once a strategy proves its resilience, FP&A teams allocate capital based on risk-adjusted returns, ensuring resources are directed where they can deliver the most value.
In commodities trading, not all strategies deserve equal access to resources. Capital here isn’t limited to cash - it also includes liquidity, working capital, and risk capacity. Advanced FP&A teams implement frameworks that charge trading desks for the specific resources they use. This approach forces desks to justify their allocations based on risk-adjusted returns rather than simple profit and loss [15].
Here's how governance maturity evolves with resource charging frameworks:
| Maturity Stage | Description | Resource Charging |
|---|---|---|
| Stage 1: Transparency | Daily measurement of exposure across market, credit, and liquidity. | No charges; only soft or indicative limits. |
| Stage 2: Single Resource | Detailed tracking of individual scarce resources. | Charges applied to specific resource usage. |
| Stage 3: Holistic | Resources aggregated into a unified measure, like risk capital. | Dynamic charging across the "risk triangle." |
| Stage 4: Optimization | Risk-adjusted returns fully integrated into decision-making. | Optimized resource use aligned with returns. |
Many mid-market trading operations are still in the early stages of this maturity curve. However, advancing to Stage 3 - where risk capital is treated as a single currency - can boost annual risk-adjusted returns by 15–40%. Additionally, using correlation-adjusted risk parity during market stress can improve Sharpe ratios by 8–15% [16].
After allocating capital, it's critical to align trader incentives with resource usage. FP&A teams play a key role by tying performance-based compensation to risk-adjusted metrics rather than just gross profit and loss. This ensures traders focus not only on generating returns but also on using risk capital efficiently.
A shift toward income-led steering is gaining momentum. Here, FP&A moves away from topline metrics and places greater emphasis on cost efficiency and disciplined capital use [13]. This shift is particularly important as the total commodity trading value pool is projected to shrink to $92 billion in 2025 - a 10% drop from 2024 - highlighting the need for tighter margins [13].
Effective governance also requires clear escalation paths. The F-PRA framework - built on Foundation (organizational structure and RACI), Philosophy (control vs. autonomy), Rituals (decision-making forums), and Artefacts (dashboards and reports) - offers a structured way for FP&A teams to enforce limits without creating excessive red tape [14]. For instance, Equinor’s "Ambition to Action" framework eliminates traditional annual budgets, treating each expenditure as a project with dynamic resource allocation. This approach aligns daily decisions with long-term goals [14]. Consistent reporting across trading desks further streamlines reviews, speeds up escalation, and strengthens governance overall.
Having reliable, centralized data is critical for effective FP&A, enabling governance frameworks to transform into actionable insights. Modern data infrastructure allows organizations to create a system where every desk, trade, and risk exposure contributes to a unified view.
At the core of a robust trading FP&A system lies a single source of truth - a centralized hub where trade capture, market data, and financial systems intersect. This often involves building an Operational Data Store (ODS) that consolidates raw data from ETRM systems, ERP platforms, and spreadsheets into a central staging area. From there, a star schema model - with fact tables for quantitative data (like trades and exposures) and dimension tables for descriptive attributes - ensures efficient performance for complex P&L and risk assessments [18].
To maintain the integrity of analysis, it's vital to separate data extraction from translation logic. Altering raw data during the loading process can distort downstream analysis. Keeping these processes distinct ensures that FP&A dashboards provide an accurate reflection of market events [18].
The focus in commodities trading is shifting from end-of-day settlement to intraday decision-making. As Shamil Shah, Partner at Baringa, explains:
"Market leaders aren't the ones who best settle a trade, they're the ones who best originate it. Value is generated by the ability to predict, optimise, and respond – often intraday, sometimes in real-time." [19]
Modern data architectures also accommodate unstructured data - like contracts, emails, and shipping records - using AI and automation. This can cut the time needed to assess exposure from days to just minutes [17].
Once a solid data foundation is in place, the next step is leveraging technology layers to turn raw data into meaningful insights. Here's a breakdown:
| Layer | Function | Key Tools |
|---|---|---|
| 5: Intelligence & AI | Predictive analytics, AI agents | ClearDox, Enverus Instant Analyst [8][23] |
| 4: Reporting & BI | P&L dashboards, risk reporting | Power BI, Tableau, Snowflake [8][21] |
| 3: Operations | Freight, vessel tracking, documents | FreightTender, Kpler, Vortexa [8] |
| 2: Finance | ERP, hedge accounting, tax | SAP S/4HANA, Dynamics 365 [8][20] |
| 1: Core Trading (CTRM) | Trade capture, position, MTM | Openlink, Allegro, Eka One [8][22] |
The CTRM system serves as the backbone, managing deal capture, position tracking, and mark-to-market valuation. However, it shouldn't double as a data warehouse. Many trading firms are decoupling their CTRM systems from analytics layers, creating independent intelligence tiers that allow for faster experimentation without disrupting live operations [8].
For mid-market firms, starting with the Operations layer (Layer 3) often delivers the quickest returns. Digitizing freight procurement and document management can lead to notable gains. Many firms report 15–25% cuts in demurrage costs and 40–60% reductions in manual operations headcount within 18 months. For instance, a company handling $500 million in annual volume could save $3.75 million annually by improving freight rates by just 3% through digital tendering [8].
Beyond structured data, advanced analytics and AI take FP&A capabilities to the next level.
Advanced analytics and AI enhance FP&A by automating tasks and improving decision-making in fast-changing markets. One key benefit is automating routine processes. For example, automated document processing with OCR and NLP can reconcile trade confirmations and invoices across the hundreds of documents generated during a single trade lifecycle, identifying discrepancies before settlement [8][17].
Machine learning models for commodities perform best when rooted in economic theory. Factors like carry, basis, momentum, and skewness - drawn from the theory of storage and hedging pressure hypothesis - often outperform generic models that treat commodities like equities. Cross-sectional models, which rank commodities relative to each other, have shown particular success in identifying systematic alpha [24].
These concepts aren't just theoretical. In 2026, Freepoint Energy used AI-based document analysis to uncover systemic demurrage overcharges at a major oil facility, identifying patterns that human reviewers missed and recovering significant refunds [8]. Similarly, Vitol applied AI-driven operations data to automate settlement tasks, enabling teams to focus on more valuable work like natural gas actualization while improving pricing accuracy [8]. StoneX used AI to analyze granular quality data from thousands of grain deliveries, helping merchandisers pinpoint top suppliers and calculate the exact harvest percentage from each [8].
Before diving into AI pilots, it’s essential to establish a stable data integration framework. A central data warehouse - using platforms like Snowflake or Azure Synapse - that aggregates clean data from CTRM, ERP, and market feeds is a must for reliable machine learning outputs [8].
Throughout this guide, it’s clear that strong FP&A practices don’t just address challenges - they actively create measurable opportunities. FP&A isn’t merely a support function; it plays a central role in driving commercial success. For mid-market commodities traders, achieving consistent gains depends on better data management, tighter liquidity oversight, and disciplined capital allocation - all built on a solid FP&A foundation.
Firms that focus on integrating CTRM and ERP systems before diving into advanced AI solutions see real results. For example, companies have reported cutting demurrage costs by 15–25% and reducing manual operations headcount by 40–60% [8]. Tools like live 30/60/90-day cash flow forecasts help avoid margin call crises, while systematic P&L attribution ensures firms can distinguish genuine alpha from market beta, enabling smarter capital deployment. These practices lay the groundwork for strategic partnerships and lasting competitive advantages.
The real risk for mid-market firms isn’t delaying AI adoption - it’s building on shaky foundations. As Aurex Group aptly puts it:
"The AI race in commodity trading is less a technology race than an organizational readiness race." – Aurex Group [26]
Establishing a strong data infrastructure is what unlocks the potential of scenario analysis, machine learning, and other advanced tools. At Phoenix Strategy Group, we work with mid-market firms to create the FP&A systems they need for sustained success. From data engineering and integrated financial modeling to fractional CFO services and cash flow forecasting, we focus on creating stable foundations before layering in advanced analytics. Learn more about our approach at Phoenix Strategy Group.
In 2023, commodity trading firms generated $104 billion in revenue [25]. The firms that succeed are the ones that treat FP&A as a strategic partner, not an afterthought. The tools and frameworks outlined here are available to mid-market players today. By leveraging these proven FP&A techniques, firms can secure lasting, meaningful gains.
FP&A supports trading desks in achieving better performance by moving away from static budgets and adopting dynamic, data-driven approaches that sharpen decision-making. Phoenix Strategy Group facilitates this transformation with integrated systems that provide real-time insights into cash positions and market risks. Through rolling forecasts and automated modeling, teams can respond effectively to fluctuating commodity prices, manage liquidity more efficiently, and fine-tune hedging strategies. This approach helps stabilize margins and improve capital allocation, even in unpredictable market conditions.
Switching from rigid annual budgets to flexible rolling forecasts, especially when paired with real-time data integration, can significantly boost accuracy. By automating inputs like commodity indices, ERP data, and CRM pipelines, you cut down on manual errors. Plus, leveraging machine learning can trim forecast errors by 10–20%, giving you a more precise picture of future trends.
On top of that, scenario planning - where you model best-case, worst-case, and likely outcomes - provides a way to stress-test your assumptions. This approach ensures you're better equipped to handle market shifts and unexpected challenges.
To keep an eye on liquidity and the risk of margin calls, tools like Margin at Risk (MaR) can help estimate potential cash outflows from margin calls, while Cash Flow at Risk (CFaR) connects hedging activities to cash flow consistency. Important operational metrics to focus on include the Liquidity Coverage Ratio (LCR), liquidity buffers, and the limits on facility utilization. Conducting regular stress tests and monitoring daily margin outflows can offer real-time insights, helping you stay ahead of any funding requirements.