Published on
June 1, 2026


Contribution margin (CM) is a key metric for SaaS companies because it measures how much revenue remains after covering variable costs like cloud hosting, payment processing, and onboarding. This helps determine if serving a customer is profitable and provides better insights than gross margin for decision-making.
CM is not just a financial metric - it’s a decision-making tool that helps SaaS businesses scale profitably and efficiently.
SaaS Contribution Margin by Delivery Model: Benchmarks & Key Metrics
Let’s dive into the essential metrics and calculations that help SaaS businesses understand and optimize contribution margin (CM).
Here’s the formula for calculating contribution margin:
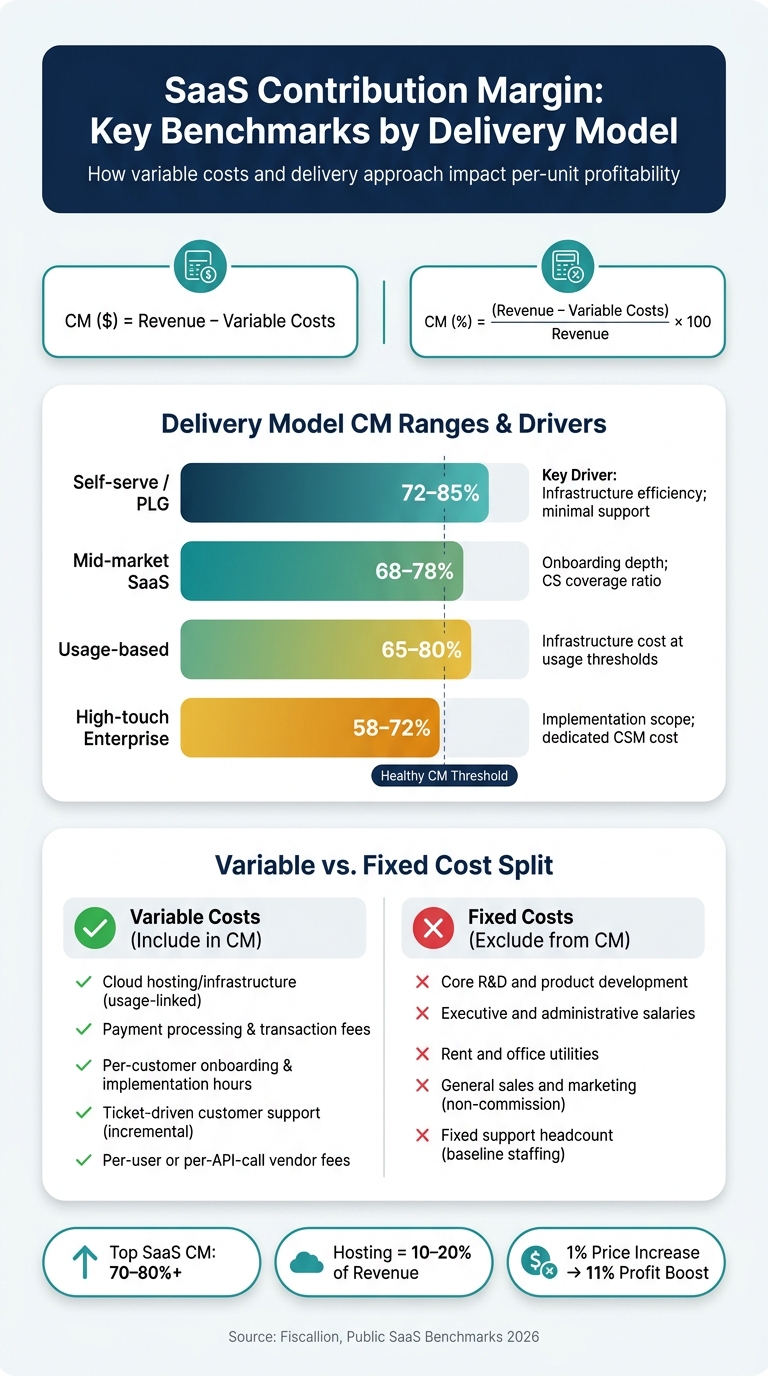
Contribution Margin ($) = Revenue − Variable Costs
Contribution Margin Ratio (%) = (Revenue − Variable Costs) / Revenue × 100 [1][2]
This formula becomes especially useful when applied at different levels: per customer, per product line, or across the entire business. Each level offers unique insights. For instance, analyzing CM per customer helps with pricing and breakeven decisions, while looking at product lines or segments can highlight differences between tiers or channels. On a broader scale, total CM reveals how efficiently the business operates before factoring in fixed costs [1]. Ignoring these granular levels can mean missing out on critical details.
Now, let’s talk about how to classify costs correctly to ensure accurate CM calculations.
To classify costs, ask yourself: If the service stops, does this cost disappear? If yes, it’s a variable cost. If not, it’s fixed [7].
In SaaS, variable costs often include cloud hosting fees, payment processing charges, and onboarding hours that vary by customer. Even incremental support costs driven by individual tickets should count as variable - excluding baseline staffing [1][4]. Hosting fees alone can take up 10–20% of revenue in SaaS operations [5].
Fixed costs, on the other hand, include expenses like R&D, executive salaries, office rent, and baseline support staff. A common mistake is misclassifying fixed support salaries as variable. Only the incremental workload tied to individual tickets should be treated as variable [1].
Here’s a quick breakdown:
| Variable Costs (Count in CM) | Fixed Costs (Omit from CM) |
|---|---|
| Cloud hosting/infrastructure (usage-linked) | Core R&D and product development |
| Payment processing & transaction fees | Executive and administrative salaries |
| Per-customer onboarding & implementation hours | Rent and office utilities |
| Ticket-driven customer support (incremental load) | General sales and marketing (non-commission) |
| Per-user or per-API-call vendor fees | Fixed support headcount (baseline staffing) |
Getting these classifications right is crucial for determining pricing strategies and assessing scalability in SaaS models.
Granular CM analysis - whether at the customer or unit level - provides powerful insights into profitability and helps pinpoint areas for improvement. A “unit” is typically defined by your pricing model. For example, in seat-based SaaS, a unit might be a single customer account, while in usage-based models, it could be a transaction, API call, or active seat during a billing period [3].
Blended CM percentages often hide critical differences between segments. For example:
"A company can report a healthy 74% gross margin while running a negative contribution margin on its lowest-tier customers - if the variable cost to onboard and support those customers exceeds what they pay." - Fiscallion [1]
Self-serve and product-led growth (PLG) models tend to have higher per-unit CM - around 72–85% - because their delivery costs are largely tied to infrastructure. In contrast, high-touch enterprise models typically fall between 58–72%, as they incur higher costs for implementation and dedicated customer success managers [1]. Neither approach is inherently better, but understanding these differences by segment allows SaaS teams to make smarter decisions about pricing and resource allocation with fractional CFO services.
| Delivery Model | Typical CM Range | Key Driver of Variance |
|---|---|---|
| Self-serve / PLG | 72–85% | Infrastructure efficiency; minimal support |
| Mid-market SaaS | 68–78% | Onboarding depth; CS coverage ratio |
| High-touch Enterprise | 58–72% | Implementation scope; dedicated CSM cost |
| Usage-based | 65–80% | Infrastructure cost at usage thresholds |
Gross margin and contribution margin both measure profitability, but they tackle different aspects of it. Gross margin evaluates overall company efficiency by subtracting all Cost of Goods Sold (COGS) - this includes variable costs and allocated fixed costs like support salaries and infrastructure amortization. On the other hand, contribution margin zeroes in on variable costs directly tied to serving an additional customer. This makes a big difference. Gross margin is built for external reporting under GAAP, while contribution margin serves as an internal tool for analyzing unit economics, pricing strategies, and customer acquisition cost (CAC) payback.
As Martin Duben, Founder of Onetribe, aptly said:
"Gross margin tells you what happened in the accounts. Contribution margin tells you what to do about it." [7]
Here’s a quick comparison of the two:
| Feature | Gross Margin | Contribution Margin |
|---|---|---|
| Cost Basis | Revenue minus all COGS (variable + allocated fixed) | Revenue minus variable costs only |
| GAAP Compliant? | Yes | No |
| Primary Use | Investor reporting, company-wide efficiency | Unit economics, pricing, CAC payback |
| Scalability View | Blended; can hide segment-level inefficiencies | Granular; reveals per-customer profitability |
For mature SaaS companies, contribution margins typically fall between 70–80%, with top performers sometimes exceeding 80% [3]. By comparison, the median public SaaS gross margin in 2026 is expected to range from 75–78% [8]. However, even with a strong gross margin, certain customer segments might still operate at a loss.
Take Bill.com's 2017 customer cohort as an example. Initially, they posted a contribution margin of –108%, with $6.7M in revenue offset by $11.8M in sales and marketing costs and $2.3M in cost of sales. But by fiscal 2019, as acquisition costs were no longer incurred and customer revenue grew to $17.3M, the cohort's contribution margin rebounded to 76% [6]. Similarly, Confluent’s 2018 cohort started at –107% but climbed to 63% by 2020, fueled by $46.7M in subscription revenue and a 125% net dollar retention rate [6].
These examples highlight a key insight: negative contribution margins in the early stages are common due to high acquisition and onboarding costs. What matters most is the trajectory - strong improvement over time signals sustainable unit economics and long-term viability.
A high contribution margin is a cornerstone of sustainable growth. It drives operational leverage, meaning each additional revenue dollar contributes more toward covering fixed costs and generating profit. Without granular insight into per-customer and per-segment margins, SaaS companies risk scaling inefficiencies alongside revenue growth. A weak contribution margin, on the other hand, can magnify losses as the business scales.
One challenge gaining attention in 2026 is the impact of AI features bundled into existing pricing tiers. These features are increasing COGS by 5–15 percentage points without corresponding price adjustments [8]. While gross margin metrics might still look solid, this trend can obscure underlying inefficiencies and erode contribution margins.
Contribution margin (CM) is a straightforward way to assess your pricing model. By calculating CM across different tiers or channels, you can pinpoint how pricing decisions impact per-customer profitability - not just overall revenue.
The numbers speak for themselves. For example, a 20% discount can slash per-customer profit by 28%, while a 5% price bump can increase per-unit profit by 7%. Even a small 1% pricing adjustment can boost operating profits by 11% [4].
Your go-to-market model heavily influences the acceptable CM range. Enterprise-focused tiers, which often involve high-touch sales, can sustain lower CM percentages because the absolute dollar contribution per account is higher. In contrast, self-serve or product-led growth (PLG) models require higher CM to offset their lower average revenue per account (ARPA) [1]. If your CM doesn’t align with your business model, it’s a red flag to reevaluate both pricing and cost structures. This analysis lays the groundwork for segment-specific pricing strategies.
Using a single CM metric can mask profitability issues within specific customer segments. To truly understand which segments are driving - or draining - profitability, you need to break down CM by tier, acquisition channel, customer cohort, and industry vertical.
Take Fiscallion’s case study, for instance. A SaaS company with $10 million in annual recurring revenue (ARR) initially reported a 68% CM. After a finance audit corrected the misclassification of salaried customer success managers (CSMs) and support engineers as variable costs, the actual CM was 76%. The audit also revealed that a lower-priced customer segment, which the company was aggressively targeting, would have operated at just 51% CM - far below what was sustainable. Leadership ultimately decided to drop that tier to protect profitability [1].
This highlights a common issue: high net revenue retention (NRR) doesn’t always equate to high profitability. If the variable costs for a segment - like dedicated CSMs, custom onboarding, or heavy support needs - exceed the revenue growth from that segment, it can quietly erode margins. Identifying these underperforming segments allows for targeted adjustments to improve margins.
The most effective ways to boost CM include lowering the cost-to-serve, optimizing infrastructure, and increasing revenue from existing customers.
Automating delivery processes is often the quickest win. For instance, replacing manual onboarding with guided in-app experiences or leveraging AI for customer support can transform variable costs into fixed infrastructure costs. This means each new customer adds less incremental expense [1]. On the infrastructure side, switching to reserved or auto-scaling cloud instances and negotiating annual contracts can keep hosting costs below 5% of revenue [9].
Focusing on net revenue retention (NRR) is another critical lever. Expansion revenue from existing customers typically comes with minimal additional costs compared to acquiring new customers. Targeting NRR levels between 110% and 130% allows you to grow revenue without proportionally increasing expenses, which directly improves CM [9]. As Fiscallion explains:
"A 10-point improvement in contribution margin translates directly to the profitability component if you are holding fixed costs flat." [1]
Lastly, if your CM is below 60%, consider conducting a value audit before cutting costs. If your product delivers exceptional value relative to its price, raising prices by 10–20% can immediately improve CM without altering your cost structure [1][9]. Using real-time data dashboards to integrate these pricing insights can further refine your operational strategies.
Monthly or quarterly reports just can't keep up with the fast-paced world of SaaS. Timely insights are essential. Consider this: net profitability across businesses dropped from 4.3% to 3.4% in 2024, marking the steepest decline in a decade [7]. In such a volatile environment, being able to respond quickly to changing costs or customer behavior is crucial. For example, instead of applying a blanket price increase that might alienate price-sensitive customers, you could focus on raising prices selectively in your highest-margin segments.
"Without contribution margin analysis, companies cannot answer the most basic management question: where do we actually make money?" - CFO Upgrade [7]
Blended contribution margin (CM) figures can be misleading. They often hide the performance of specific segments. By tracking CM by pricing tier, acquisition channel, or cohort vintage, you can pinpoint which areas are driving profits and which are quietly underperforming [1]. This need for clarity is why live dashboards that provide detailed, actionable insights are becoming essential.
A good contribution margin dashboard pulls together revenue and cost data into one real-time view. For accuracy, focus on net revenue - this means accounting for discounts, credits, and refunds. Only include true variable costs like cloud hosting, payment processing fees, onboarding hours, and support costs tied to customer activity [1]. Leave out fixed costs that don’t scale with customer numbers.
To keep things clear, structure your dashboard in layers:
| Layer | What It Shows |
|---|---|
| CM I | Revenue minus direct variable costs (calculated per customer or segment) |
| CM II | CM I minus attributable fixed costs (e.g., costs for dedicated account managers) |
| Segment View | A detailed breakdown of CM I and CM II by pricing tier, acquisition channel, and cohort vintage |
This layered approach gives decision-makers the tools to tweak pricing and manage costs in real time, helping to maintain profitability.
"Contribution margin by segment belongs in your monthly business review... When CS sees that their high-touch onboarding approach runs a 45% contribution margin on SMB customers versus 71% on mid-market, that is a decision-forcing data point, not a finance report." - Aleksandar Stojanovic, CEO & Founder at Fiscallion [1]
By offering this level of detail, contribution margin evolves from a static financial metric into a dynamic tool that leadership teams can actively use.

Even with a solid framework for a dashboard, many SaaS companies struggle to implement it. The challenge often lies in integrating data from various silos - revenue, infrastructure, and support systems - into a seamless, real-time view.
This is where Phoenix Strategy Group comes in. They specialize in helping growth-stage SaaS companies overcome these hurdles. Their expertise in data engineering and FP&A services allows them to create integrated financial systems that pull live data from billing systems, cloud infrastructure, and support platforms into one cohesive dashboard. Their Monday Morning Metrics reports and real-time data synchronization ensure leadership teams always have access to the latest numbers, not outdated reports.
For SaaS companies looking to scale, secure funding, or prepare for an acquisition, having accurate, real-time CM data is more than just operationally helpful - it signals to investors and buyers that the leadership team has a firm grasp on its unit economics.
The contribution margin helps determine if each customer is generating profit. Unlike gross margin, it focuses solely on variable costs - things like hosting, payment processing, and onboarding - while excluding fixed expenses. For mature SaaS companies, a healthy contribution margin typically falls between 60–75%, with top-tier performers reaching over 80% [1][3]. However, relying on a blended contribution margin can sometimes obscure issues within specific customer segments. Even small pricing adjustments can have a big impact; for instance, a 1% price increase can lead to a 12.3% boost in operating profit [7].
"Contribution margin is not a metric you report. It is a metric you use to make decisions." - Fiscallion [1]
The most effective SaaS companies don’t just track contribution margin - they act on it. They use it to refine metrics like CAC payback, analyze profitability by pricing tier or acquisition channel, and monitor for margin erosion through real-time dashboards. This detailed focus on per-customer economics provides a foundation for making smarter financial decisions throughout the SaaS lifecycle.
To put these strategies into action, you need more than just insights - you need the right systems in place. Real-time tracking of contribution margin requires seamless integration of billing, infrastructure, and support data. Phoenix Strategy Group specializes in helping growth-stage SaaS companies build the financial infrastructure needed to monitor contribution margins effectively. They assist in evaluating profitability across customer segments and making data-driven decisions about pricing and capital allocation. Whether your company is scaling, raising funds, or preparing for an exit, this kind of financial clarity can provide a critical edge over competitors.
In the SaaS world, variable costs are those expenses that rise whenever you gain a new customer or when usage increases. A simple way to identify these costs is by asking: Does this expense grow as more customers are added? If the answer is yes, it's a variable cost.
Here are some common examples:
Companies like Phoenix Strategy Group specialize in pinpointing these costs and evaluating how they impact overall profitability.
To figure out the contribution margin for a specific customer segment, start by identifying the average revenue per user (ARPU) for that group. Next, calculate the total of all direct variable costs associated with serving that segment. These costs typically include:
Once you have these numbers, subtract the total variable costs from the segment's revenue. You can express the contribution margin as either a dollar amount or a percentage. To calculate the percentage, use this formula:
(Revenue - Variable Costs) / Revenue × 100
For a more streamlined approach, Phoenix Strategy Group offers expertise in integrating financial data to simplify this analysis process.
There’s no one-size-fits-all target for contribution margin - it largely depends on your delivery model and where your company is in its growth journey. For mature SaaS companies, the sweet spot often falls between 70–80%, with industry leaders pushing beyond 80%.
Here are some typical benchmarks based on delivery models:
If your margins dip below 70%, it could point to inefficiencies. This is where Phoenix Strategy Group steps in, offering expertise in FP&A and data engineering to help fine-tune your operations.