Published on
June 30, 2026


If one input changes and your cash forecast does not move, the model is broken. I’d boil this down to one rule: sales, pricing, churn, hiring, and billing timing should flow into revenue, margin, cash, and the balance sheet every month.
Here’s the short version for a $500,000 to $10 million U.S. company:
A flat growth rate can hide a big problem. For example, a plan may assume $6.2 million in new ARR while the current team can only support $4.1 million. A linked model shows that gap before you lock in spend.
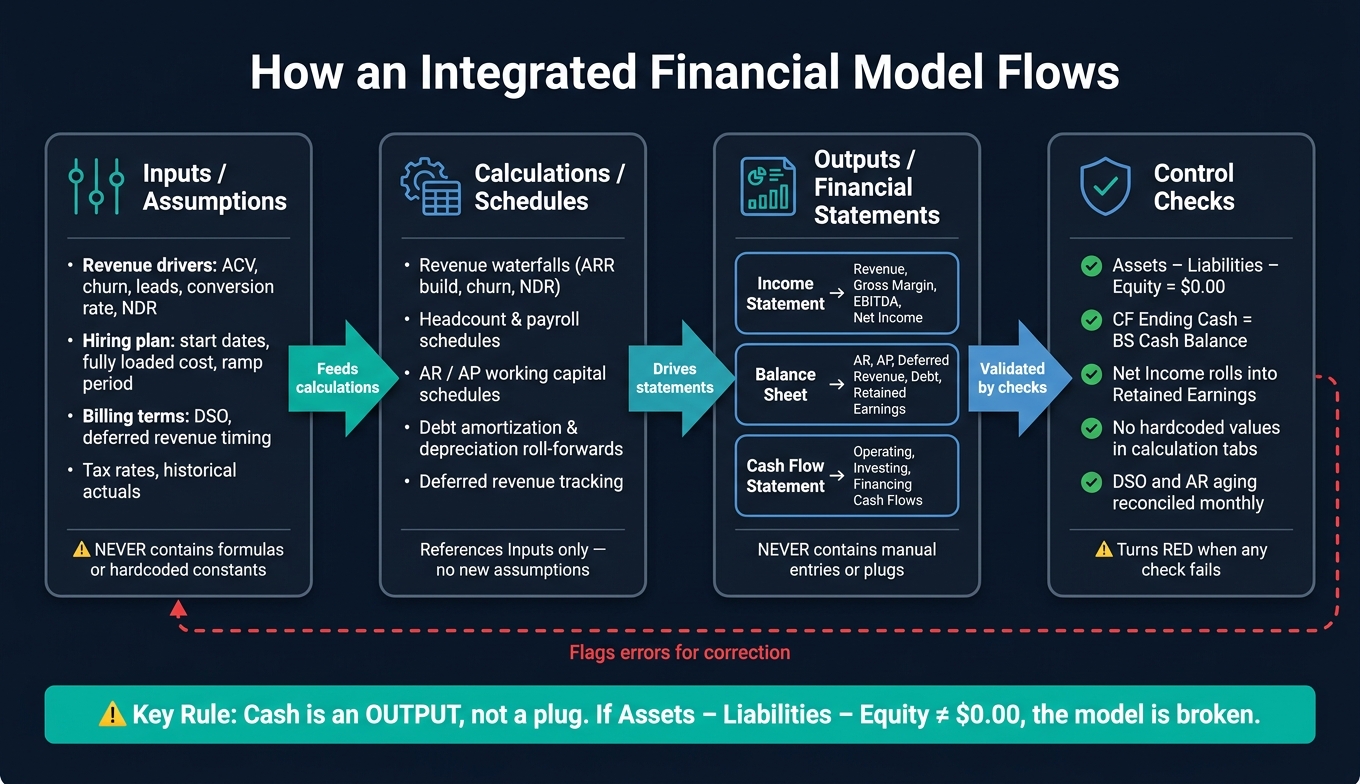
The main takeaway is simple: cash should be an output, not a plug. If Assets − Liabilities − Equity ≠ $0.00, if ending cash on the cash flow statement does not match the balance sheet, or if net income does not roll into retained earnings, I know the links need work.
| Area | What I focus on |
|---|---|
| Revenue build | Leads, win rate, ACV, churn, NDR, billing terms |
| Cost build | Hiring dates, loaded pay, commissions, software, marketing |
| Statement flow | Income statement, balance sheet, cash flow |
| Timing | DSO, deferred revenue, payroll accruals, debt interest |
| Checks | Balance sheet tie, cash tie, retained earnings roll-forward |
Below, I sum up how the driver map, schedules, and statement links work together so the forecast stays usable month by month.
Integrated Financial Model: How Drivers Flow Into Statements
Monthly outputs only hold up when the model runs in one direction: inputs feed calculations, calculations feed outputs, and checks catch mistakes. If that flow gets mixed up, the model can go sideways fast. After that structure is in place, the next job is to map the operating drivers behind each forecast line.
Each layer in the model has one job. Trouble starts when those jobs bleed into each other. Assumptions should live in one place. Formulas should live somewhere else. And outputs should NEVER include manual entries.
Don't hardcode assumptions inside formulas. Put every assumption - ACV, churn, hire date, DSO - in labeled input cells, and keep formulas clear of buried constants.
The table below shows what belongs in each layer, and what doesn't:
| Layer | Contains | Should NEVER Contain |
|---|---|---|
| Input / Assumptions | Revenue drivers (ACV, churn), hiring plan, historical actuals, billing terms, tax rates | Formulas that calculate final outputs or hardcoded constants buried in logic |
| Calculation / Schedules | Revenue waterfalls, headcount schedules, working capital (AR/AP), debt amortization, depreciation roll-forwards | New assumptions or manual overrides - everything must reference the Input layer |
| Output | Linked statements and KPI dashboard | Manual entries or "plugs" to make the statements balance |
| Checks | Balance sheet tie, cash reconciliation, variance flags | Hidden errors or ignored variances |
Use monthly columns for 36 to 60 periods, with quarterly and annual rollups for board decks and lender reporting [3][5]. The monthly view matters most in the first 12 to 24 months [3], when burn rate and runway choices carry the most weight.
Timing is where integrated models most often go wrong. Usually, the issue isn't the math. It's when the math hits.
Three timing mismatches show up again and again.
That's why driver timing has to line up with financial timing. If it doesn't, runway and cash forecasts stop being something you can trust. Once timing is lined up, the model can turn operating drivers into revenue, spend, and hiring plans.
Once timing is lined up, the next step is to map the operating levers behind revenue, cost, and cash. This is the point where operating assumptions turn into forecast outputs. A driver map lets you follow each assumption into the monthly schedules that flow into the financial statements.
Start by mapping the funnel from spend to leads, opportunities, closed-won deals, and bookings. From there, conversion rates and ACV shape how much revenue those bookings create. Billing terms then control deferred revenue, accounts receivable, and the timing of cash collections.
Churn matters just as much as new bookings. Ignore churn, and ARR projections get inflated fast. Net Dollar Retention (NDR) is a cleaner way to track this: median NDR for B2B SaaS sits around 110% [3]. That means a healthy customer base can grow revenue even without new sales. Put that figure in the model as a direct driver, not as a side note.
| Revenue Driver | Financial Line Affected | Primary Forecast Output |
|---|---|---|
| Leads / Traffic | Marketing Spend (OpEx) | New Bookings Pipeline |
| Conversion Rate | New ARR (Income Statement) | Customer Count |
| Average Contract Value (ACV) | Revenue / New ARR | Booking value |
| Billing Terms | Deferred Revenue / AR | Cash timing |
| Churn Rate | Net retention / NDR | Ending ARR / LTV |
| Sales Capacity (AEs) | Salaries / Commissions (OpEx) | New ARR Growth |
| DSO | Accounts Receivable (Balance Sheet) | Working Capital Position |
Those revenue drivers only work if the hiring plan can support the capacity behind them.
Headcount is the biggest cost lever in most growth-stage companies. It usually makes up 70% to 80% of total expenses [1][7]. In plain terms, the hiring plan is also a cash forecast.
Each planned hire should have a start date, a fully loaded cost, and a productivity ramp. Fully loaded cost includes base salary, taxes, benefits, and equipment [7][8]. Beyond salary, the model also needs separate line items for commissions, contractor spend, software tools, and marketing budgets.
The table below shows how different cost types affect margin as revenue grows:
| Cost Type | Behavior | Effect on Margin |
|---|---|---|
| Pure Variable | Scales directly with revenue | Constant % of revenue |
| Step-Function | Jumps at specific thresholds | Decreases margin at the jump point |
| True Fixed | Constant regardless of volume | Improves margin as revenue grows |
One of the most common modeling mistakes is treating every cost like a percentage of revenue. That sounds neat on paper, but it breaks in practice. A customer support team, for example, may stay flat for a while and then need one full new hire when ticket volume crosses a threshold. Model that step the right way, and the cash forecast looks grounded. Miss it, and the forecast can give a false sense of control.
The next test is simple: can the team actually produce the revenue the model assumes?
This is where many integrated models quietly fall apart. If the revenue plan assumes more output than the team can deliver, the model will overstate growth and understate burn.
The fix is to build revenue from capacity upward. For a sales team, the math is straightforward: number of AEs × quota × attainment rate = projected new ARR. Ramp matters too. New AEs rarely hit full quota until month six, and customer success capacity should be tied to tickets or accounts per rep [2].
When these assumptions are spelled out, you can test the plan without guesswork. You can see whether the revenue target matches the current hiring plan - or whether the model is quietly relying on people who are not on the team yet.
With the driver map set up, the next job is to push each driver into the income statement, cash flow statement, and balance sheet on the same monthly timeline. No manual plugs. No patched-in ending numbers. The model should flow cleanly from one statement to the next.
A model doesn't work just because it shows profit. Cash comes down to timing.
If payroll is recorded before it's paid, that creates an accrued expense on the balance sheet. If a vendor sends an invoice and payment hasn't gone out yet, that amount sits in accounts payable. And if a customer pays before revenue can be recognized, billing timing creates deferred revenue and moves cash ahead of revenue.
That's where the cash flow statement does its job. Under the indirect method, it starts with net income, then adjusts for non-cash items like depreciation and for working capital changes in AR, AP, and deferred revenue.
That same timing logic needs to carry through every balance sheet account with monthly roll-forwards. If the timing is off in one place, the whole model starts to wobble.
For AR, PP&E, debt, and retained earnings, use roll-forwards:
Beginning Balance + Additions − Reductions = Ending Balance
Hardcoding ending balances instead of rolling them forward breaks the model's internal logic.
Use the table below to trace how each schedule hits the three statements:
| Schedule / Driver | Income Statement Link | Balance Sheet Link | Cash Flow Statement Link |
|---|---|---|---|
| Revenue | Revenue (Top Line) | Accounts Receivable / Deferred Revenue | Cash Receipts (Operating) |
| Payroll | Salaries & Benefits / Commissions | Accrued Expenses | Payroll Payments (Operating) |
| OpEx | Operating Expenses | Accounts Payable / Prepaids | Vendor Payments (Operating) |
| CapEx | Depreciation Expense | Fixed Assets (PP&E) | Asset Purchase (Investing) |
| Debt | Interest Expense | Debt Principal Balance | Draws / Repayments (Financing) |
| Equity | Net Income (via Retained Earnings) | Common Stock / Retained Earnings | Capital Raises / Dividends (Financing) |
For debt schedules, calculate interest from prior-month debt to avoid circularity.
And one rule matters more than most: never use cash as a manual plug. Cash should come out of the cash flow statement on its own. A good model makes cash the result, not the fix.
Keep a visible check on the main dashboard:
Assets − Liabilities − Equity = 0 [4][6]
That way, if something breaks, you see it right away.
Phoenix Strategy Group helps growth-stage companies design and maintain integrated financial models, including FP&A, bookkeeping, fractional CFO support, data engineering, and M&A prep.
Once these links are in place, control checks should flag any break right away.
Once the model is linked, the last step is finding breaks before they show up in the board deck or lender model. The issues that cause the most trouble are hardcoded values, circular debt math, and timing mismatches.
Hardcoded values entered straight into statement lines are a common problem. When that happens, scenarios stop moving when drivers change.
Circular references tend to show up in debt schedules. The usual fix is simple: calculate interest from prior-period debt so the loop doesn’t feed into itself.
Timing mismatches are trickier. A 45–60 day collection delay can make cash look available before collections hit the account. That’s why it helps to track DSO and AR aging every month. In many cases, cash stress shows up there before it appears in the P&L.
A few other errors come up all the time too:
A dedicated Checks tab, with conditional formatting that turns red when something fails, can catch issues before they affect a decision. Without steady reconciliation, errors can push revenue projections 20% to 35% off and operating expenses 15% to 25% off before the issue reaches the statements [3].
Run these checks every time the forecast changes:
| Common Model Error | Visible Symptom | Control Check |
|---|---|---|
| Balance Sheet Out of Balance | Assets ≠ Liabilities + Equity | ROUND(Total Assets − Total Liab − Total Equity, 2) = 0 |
| Cash Reconciliation Failure | CF ending cash ≠ BS cash balance | ROUND(CF Ending Cash − BS Cash, 2) = 0 |
| Retained Earnings Mismatch | Net income doesn't roll into equity correctly | BS End RE − BS Beg RE − IS Net Income + Dividends = 0 |
| Double-Counted Capex | Cash falls more than the PP&E schedule implies | Variance review: investing cash flow vs. PP&E additions |
| Unmodeled Churn / Timing | Revenue grows but cash deteriorates | Sanity check on AR aging and DSO trends |
| Incorrect Hiring Logic | EBITDA overstated; new hires assumed 100% productive on Day 1 | Review headcount productivity ramp assumptions |
| Hardcoded Assumption | Forecast doesn't move when drivers change | Scan calculation tabs for hardcoded values |
A useful integrated model keeps drivers tied to schedules, and schedules tied to statements. Revenue should come from operating drivers. Hiring should reflect actual start dates and ramp periods. Cash should come out of the model itself, not from a manual plug.
Run the balance sheet, cash reconciliation, and retained earnings checks every month. Then update drivers when assumptions drift. If a driver change doesn’t move revenue, cash, or the balance sheet, the link is broken.
A financial model is integrated when it runs as one connected system, linking operating inputs directly to financial results.
Change one input - like adding a sales hire, changing pricing, or adjusting churn - and that change should flow on its own through the income statement, balance sheet, and cash flow statement. That keeps the model consistent and gives decision-makers one shared view of the business.
Cash should be an output. That way, the model shows how operating choices flow through to actual liquidity.
If you use cash as a plug just to make the balance sheet tie, it's easy to hide errors. It can also blur the real effect of the business drivers.
When cash is derived from the integrated P&L and balance sheet - through items like working capital, debt, and capex - you get a much clearer picture of how growth either uses capital or throws off capital. It also makes runway projections more realistic.
Use three layers of checks to catch broken links in an integrated financial model.
This setup works like a safety net. The core checks catch big structural issues. The schedule-level checks help you spot where a link likely broke. And the sanity checks answer the bigger question: does this model make business sense, or does something feel off?