Published on
July 31, 2025

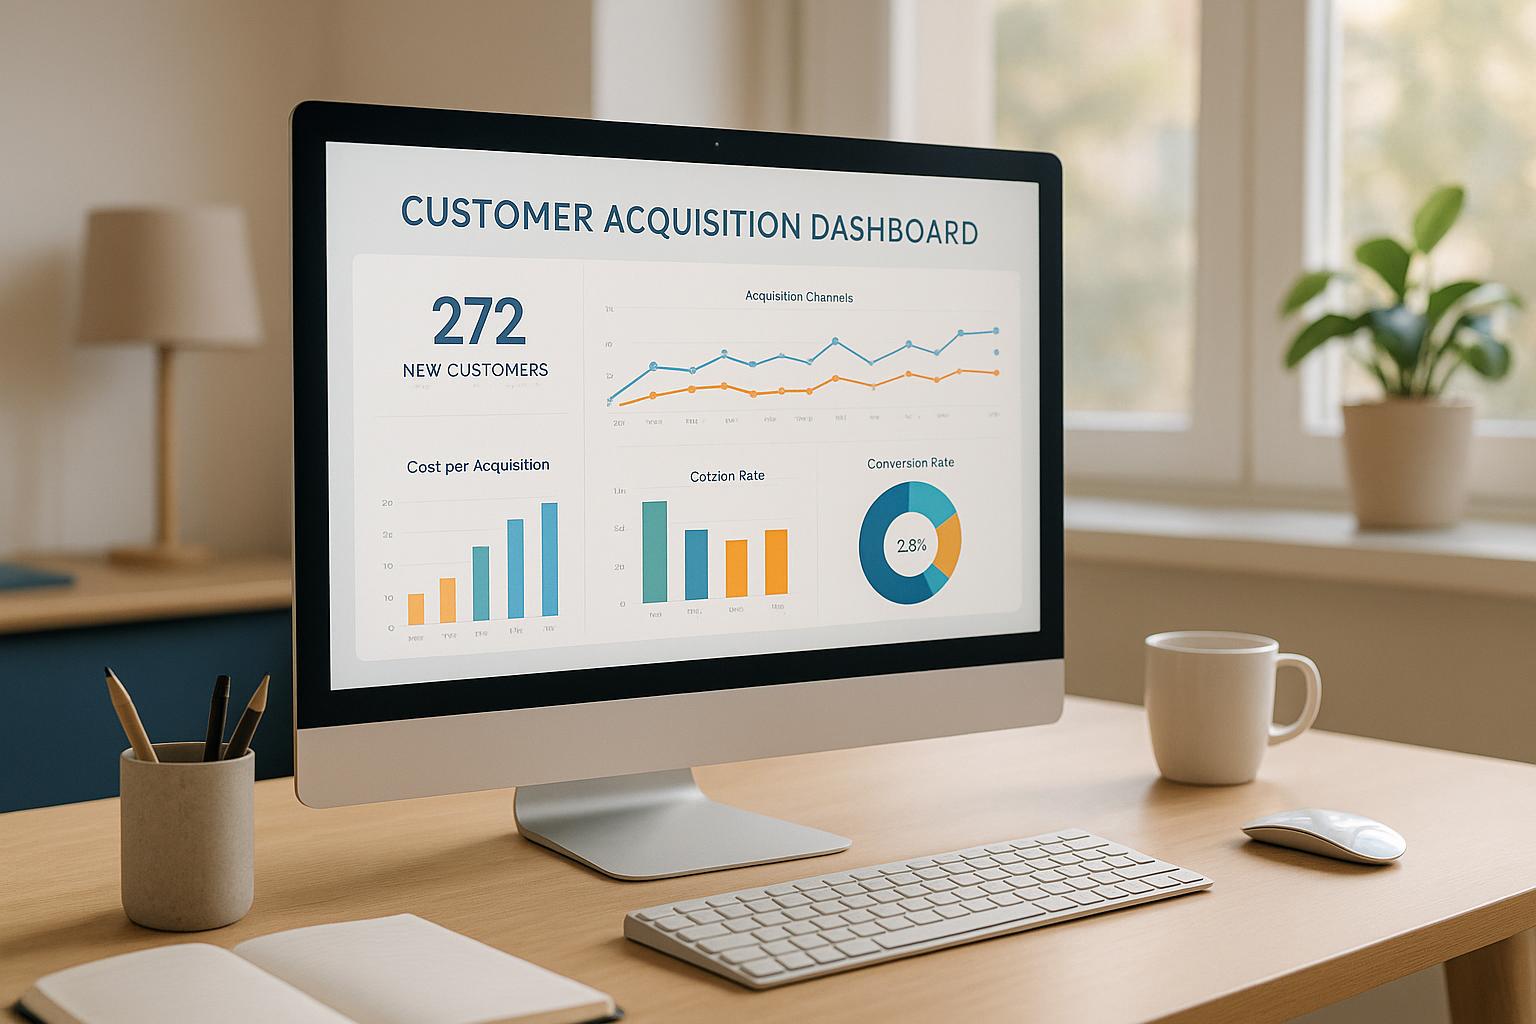
Customer acquisition dashboards simplify how businesses track and improve their customer growth strategies. They consolidate scattered data from multiple sources like marketing, sales, and finance into one clear view. This helps companies monitor critical metrics, make informed decisions, and optimize spending.
Here’s what you need to focus on:
Dashboards also solve common problems like fragmented data, attribution issues, and delayed insights by integrating systems, enabling multi-touch attribution, and providing real-time updates. Tools like those from Phoenix Strategy Group tailor dashboards for growth-stage companies, ensuring they focus on the most impactful metrics while automating data updates for accuracy and speed.
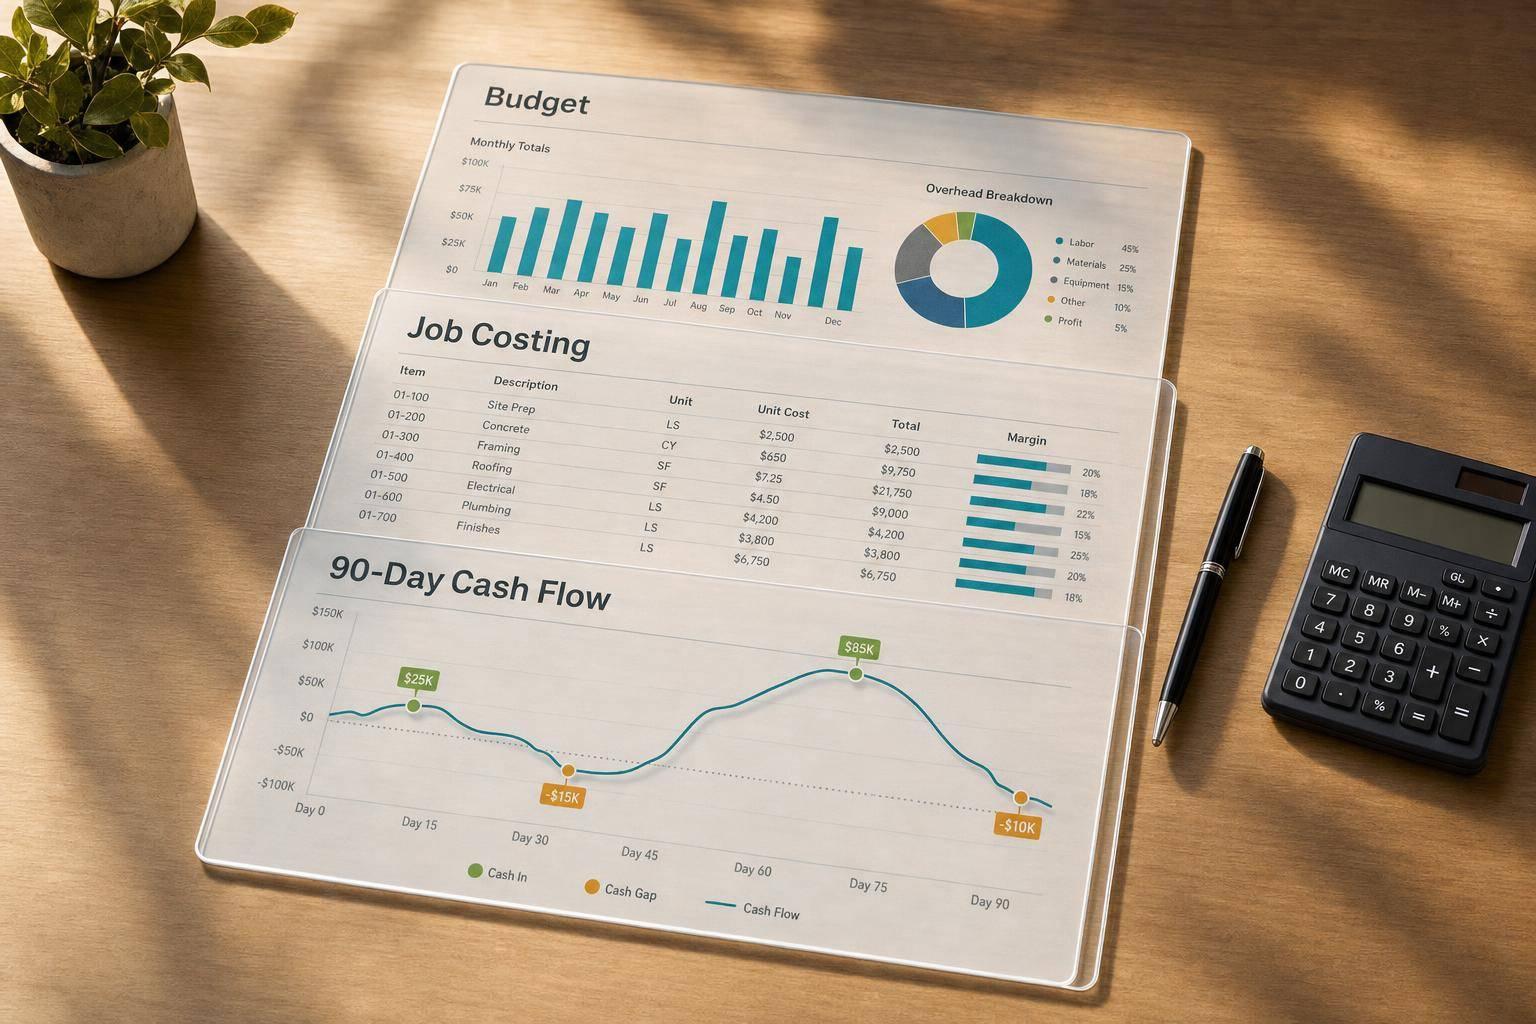
Creating a reliable customer acquisition dashboard starts with identifying the right metrics. These five key measurements lay the groundwork for assessing how well your business attracts and retains customers. Together, they provide a detailed view of your acquisition efforts.
Customer Acquisition Cost (CAC) calculates the total expense of bringing in a new customer. This includes costs like advertising, sales team salaries, software tools, and promotional efforts.
"Customer acquisition cost (CAC) measures the total cost of gaining a new customer. It includes expenses related to sales, marketing, technical, creative, and inventory efforts. Optimizing CAC is crucial for business growth and profitability." - The Statsig Team
Breaking CAC down by channel can help identify which marketing strategies deliver the best results. For instance, SaaS companies often see an average CAC of $205, while retail averages $87, and fashion brands average $129. This segmentation allows businesses, especially those in growth stages, to allocate budgets more effectively toward high-performing channels.
Conversion rates measure the percentage of potential customers who take the desired action, such as making a purchase, at each stage of the acquisition funnel. On average, acquisition rates hover between 2–5% across most channels, but email marketing often outperforms with rates between 15% and 25%. Tracking these rates across funnel stages can reveal areas where prospects drop off, offering opportunities for improvement.
Customer Lifetime Value (CLV) estimates the total revenue a customer will generate over their relationship with your business. Average CLV can vary widely - ranging from $168 in retail to $1,202 for subscription models - depending on customer segments and acquisition sources.
CLV becomes particularly insightful when compared to CAC. A healthy ratio is about 1:3, meaning every dollar spent on acquisition should generate three dollars in customer lifetime revenue. Interestingly, channels with higher CAC often bring in customers with 50–70% greater lifetime value, emphasizing the importance of focusing on quality over cost alone.
Customer retention rate tracks how well your business keeps customers beyond their first purchase. In ecommerce, the average retention rate is around 30%, though it varies depending on the acquisition channel. By analyzing retention data alongside acquisition metrics, you can better understand customer quality and make informed decisions about budget allocation and long-term strategies.
Channel performance metrics combine CAC, conversion rates, and CLV data for each acquisition source to provide a full picture of marketing effectiveness. Surprisingly, only 25% of marketers measure incrementality, leaving many to rely on inflated ROAS (Return on Ad Spend) figures rather than true incremental growth. Companies that adopt robust channel performance tracking can see a 15–20% boost in marketing ROI by identifying which channels drive genuine, measurable results.
| Metric Type | Examples | Key Insight |
|---|---|---|
| Incremental Metrics | iROAS, Incremental conversion rate | Isolates the true impact of marketing efforts, avoiding inflated metrics. |
| Efficiency Metrics | Marginal CPC, eCPA | Highlights how efficiently ad spend drives results for better resource use. |
| Engagement Metrics | TER, RPSD | Identifies content that resonates, guiding more effective strategies. |
| Impact Metrics | Spillover rate | Measures broader effects of campaigns to understand indirect impacts. |
This data-driven approach helps businesses avoid over-relying on vanity metrics and instead focus on channels that deliver sustainable, long-term growth. By pinpointing true incremental results, companies can fine-tune their strategies for better outcomes.
Tracking customer acquisition can feel like solving a puzzle with missing pieces. Even with access to key metrics, fragmented data often clouds the picture. The rise in marketing tools - from an average of 16 in 2017 to over 100 today - has only added to the complexity. Luckily, dashboards offer a practical way to tackle these challenges head-on.
Many companies face the issue of data silos, where valuable customer information is spread across disconnected systems. For instance, your CRM might hold lead details, Google Analytics tracks website activity, social media platforms store engagement metrics, and accounting software logs revenue. When these systems don’t integrate, decisions are often based on incomplete or outdated information.
Dashboards simplify this chaos by consolidating data into a single, unified view. Using APIs and data connectors, they pull information from various platforms and standardize it. Instead of juggling multiple logins to piece together your acquisition funnel, you get a comprehensive snapshot in one place. This not only saves your team time but also ensures decisions are backed by accurate, up-to-date data. By unifying these sources, dashboards lay the groundwork for solving attribution challenges.
Attribution has long been a thorn in the side of marketing teams. Multi-channel interactions - like a customer clicking a Facebook ad, signing up through an email, and then purchasing via a Google search - make it hard to assign credit accurately. Traditional methods often rely on last-click attribution, which gives all the credit to the final touchpoint. This oversimplification can distort performance metrics like Customer Acquisition Cost (CAC) and lead to poor budget decisions.
Dashboards offer a smarter solution by enabling multi-touch attribution models. These models track the entire customer journey and distribute credit based on each channel’s actual influence. This ensures every marketing effort gets the recognition it deserves, helping teams allocate budgets more effectively. With a clearer picture of performance, you can make adjustments that truly reflect the impact of your strategies.
Manual data collection slows down decision-making, especially in fast-changing markets. Research shows that data analysts spend over 40% of their time just validating data, leaving less time for actionable insights.
Real-time dashboards solve this by automatically refreshing data, eliminating delays. When trends shift - like a sudden drop in Facebook ad performance or a spike in email conversions - your team can respond immediately instead of waiting for the next report. Automated validation also flags anomalies as they happen, ensuring data accuracy. This combination of speed and reliability empowers teams to act quickly and confidently.
| Problem | Traditional Approach | Dashboard Solution |
|---|---|---|
| Data Silos | Manual data gathering from multiple systems | Automated integration with standardized formats |
| Attribution Issues | Last-click attribution models | Multi-touch attribution with journey mapping |
| Delayed Insights | Weekly or monthly reporting cycles | Real-time data updates with automated validation |
Effective dashboards take raw data and turn it into actionable insights, helping businesses refine their strategies for customer acquisition. These practices build on earlier discussions about addressing data fragmentation and attribution challenges.
Breaking metrics into smaller, more specific categories - like channel, cohort, or time period - can uncover patterns that might otherwise go unnoticed. For example, analyzing Customer Acquisition Cost (CAC), conversion rates, and Customer Lifetime Value (CLV) by individual marketing channels lets you make smarter decisions about where to allocate your budget.
Let’s say your content marketing efforts result in a CLV of $800 with a CAC of $200, while paid ads yield a CLV of $500 with a CAC of $300. In this case, the numbers clearly suggest that content marketing offers a better return on investment, signaling a need to focus more on that strategy.
Cohort analysis adds another layer of detail. By grouping customers based on their acquisition date and tracking their behavior over time, you can see trends in customer quality. For instance, if customers acquired in January have higher retention rates than those acquired in March, it’s a sign to revisit and refine your acquisition tactics.
You can also break metrics down by geographic or demographic factors, such as region, company size, or industry. This helps pinpoint your most valuable customer segments and tailor your strategies to attract more of them.
To evaluate your performance, it’s essential to compare your metrics to industry benchmarks. Without these comparisons, it’s hard to know if a CAC of $400 is efficient or a sign of trouble.
Benchmarks vary widely across industries. For example, B2B SaaS companies generally have the lowest combined average CAC at $239, while higher education faces much steeper costs, averaging $1,143. Other sectors, like financial services and real estate, also tend to have higher acquisition costs, averaging $784 and $791, respectively. By displaying these benchmarks alongside your actual performance, you can quickly identify areas where you’re falling short or exceeding expectations.
For example, if your CAC suddenly rises above the industry average, it’s a signal to dig deeper and find the problem. On the flip side, consistently staying below benchmarks suggests your strategies are paying off.
A good rule of thumb for sustainable growth is maintaining an LTV:CAC ratio of 3:1 or higher.
| Industry | Average Organic CAC | Average Paid CAC | Combined Average CAC |
|---|---|---|---|
| B2B SaaS | $205 | $341 | $239 |
| Entertainment | $190 | $468 | $260 |
| Construction | $212 | $486 | $281 |
| IT and Managed Services | $325 | $840 | $454 |
| Manufacturing | $662 | $905 | $723 |
| Higher Education | $862 | $1,985 | $1,143 |
Keep in mind that benchmarking is most effective when your data is updated regularly.
To keep your dashboard relevant and actionable, automate your data updates. This ensures your metrics reflect the latest business conditions and allows you to respond quickly to changes.

Phoenix Strategy Group specializes in creating tailored, scalable dashboard solutions designed for growth-stage companies. These businesses often face the dual challenge of managing rapid expansion while maintaining the financial accuracy needed for fundraising and strategic planning. Phoenix Strategy Group addresses these challenges by delivering customized solutions that align with each company's unique needs.
Instead of relying on generic templates, Phoenix Strategy Group develops dashboards that focus on the three to five most impactful customer acquisition KPIs for each business. These KPIs are chosen based on the company’s goals, operational model, and growth stage.
The process begins with a detailed evaluation of the business model to pinpoint the metrics that will drive the most meaningful results. For companies in a growth phase, this often includes metrics like Customer Lifetime Value (CLV) and channel-specific performance data - key indicators that investors prioritize during fundraising.
Take, for example, their collaboration with Henry Ford OptimEyes. This project led to over 2,500 new customer purchases, a 3.9X return on marketing investment, and a 33% increase in average retail sales.
What sets Phoenix Strategy Group apart is their emphasis on actionable insights over data overload. By helping companies establish measurable targets for their KPIs, they ensure that dashboards provide clear guidance on what steps to take next. This focus on clarity and usability lays the groundwork for integrating advanced technology and data expertise, as described below.
Phoenix Strategy Group employs proprietary tools to automate and synchronize data across systems, ensuring real-time accuracy for customer acquisition metrics. Their use of advanced ETL (Extract, Transform, Load) tools eliminates manual errors by automating data cleansing and synchronization processes.
They seamlessly integrate data from various systems, tailoring updates to the needs of specific metrics. For instance, critical metrics like conversion rates and daily acquisition costs are updated in real time, while less urgent data, such as monthly cohort analysis, follows a scheduled batch process.
To maintain data quality, Phoenix Strategy Group uses robust cleansing procedures before synchronization. Their data mapping strategies ensure that information flows smoothly from source systems to dashboard destinations, avoiding the confusion and inconsistencies that often plague customer acquisition tracking.
Their Monday Morning Metrics system exemplifies this approach by consolidating data from CRM platforms, marketing tools, and financial databases into a single, unified dashboard that provides weekly KPI updates.
Security is a top priority throughout the data transfer process. Built-in protocols safeguard sensitive customer acquisition data, which is especially critical for growth-stage companies preparing for due diligence. In these scenarios, data integrity and security play a vital role in building investor confidence and supporting valuation discussions.
Dashboards aren’t just tools for tracking metrics - they’re the backbone of a strategy that supports sustainable growth. Businesses that establish effective tracking systems gain the ability to seize data-driven opportunities and showcase their value to key stakeholders.
A strong dashboard goes beyond displaying numbers. By focusing on critical metrics like CAC (Customer Acquisition Cost), CLV (Customer Lifetime Value), and conversion rates, companies can make well-informed decisions that build on each other. This approach helps spot areas for improvement, allocate marketing budgets wisely, and present a clear picture of value to investors, particularly during funding rounds.
Benchmarking against industry averages adds another layer of insight. For instance, if a company finds its CAC is $300 while the industry average is $200, this isn’t just a statistic - it’s a call to action. Such comparisons enable businesses to set achievable goals and prioritize impactful strategies. This kind of analysis underscores the dashboard’s role in fine-tuning acquisition plans.
The technology behind these dashboards must grow alongside the business. Features like automated data syncing and seamless integrations reduce manual errors and delays. Real-time updates for metrics like daily acquisition costs allow teams to adapt quickly to market shifts, while periodic updates support broader performance reviews. This evolving tech infrastructure not only streamlines processes but also bolsters investor confidence.
For companies in growth stages, particularly those aiming for a funding round or acquisition, advanced dashboards convey a sense of readiness and maturity. Investors look for clear, actionable insights into customer acquisition and proof of scalable operations. Dashboards that highlight unit economics, channel performance, and growth trends tell a story that resonates with potential backers.
Turning data into actionable insights is the key to scalable growth. When businesses pair the right metrics with thoughtfully designed dashboards, they create more than just reports - they build a strategic edge that drives long-term success.
To achieve steady growth, businesses should aim for a CLV to CAC ratio of at least 3:1. In simple terms, this means that the revenue earned from a customer should be at least three times the cost of acquiring them. Hitting this target ensures profitability and creates room for scaling.
To keep this ratio healthy, work on boosting CLV by introducing upselling and cross-selling opportunities, improving customer retention strategies, and delivering a better customer experience. On the flip side, manage CAC by fine-tuning marketing campaigns, focusing on the right audience, and using cost-effective acquisition channels. Balancing these two metrics is essential for building a business that thrives over the long haul.
Creating a customer acquisition dashboard that integrates multiple data sources is no small feat. Common hurdles include data silos, inconsistent formats, poor data quality, and unreliable APIs. These roadblocks can bog down processing, disrupt real-time insights, and make decision-making a frustrating process.
To address these challenges, businesses should prioritize a few key actions:
Additionally, scalable infrastructure is a smart investment for handling growing data volumes. By tackling these issues head-on, companies can transform messy data into clear, actionable insights that fuel smarter customer acquisition strategies.
Multi-touch attribution models offer a smarter way to understand the customer journey by spreading credit across multiple touchpoints, instead of solely focusing on the final interaction like last-click attribution does. This approach paints a clearer picture of how different channels, campaigns, and interactions work together to drive conversions.
By analyzing the role each touchpoint plays, businesses can make informed decisions about how to allocate marketing budgets, fine-tune strategies, and boost customer acquisition. It’s a practical solution to common tracking challenges, giving marketers a better grasp of what’s truly driving results.