Published on
December 24, 2025


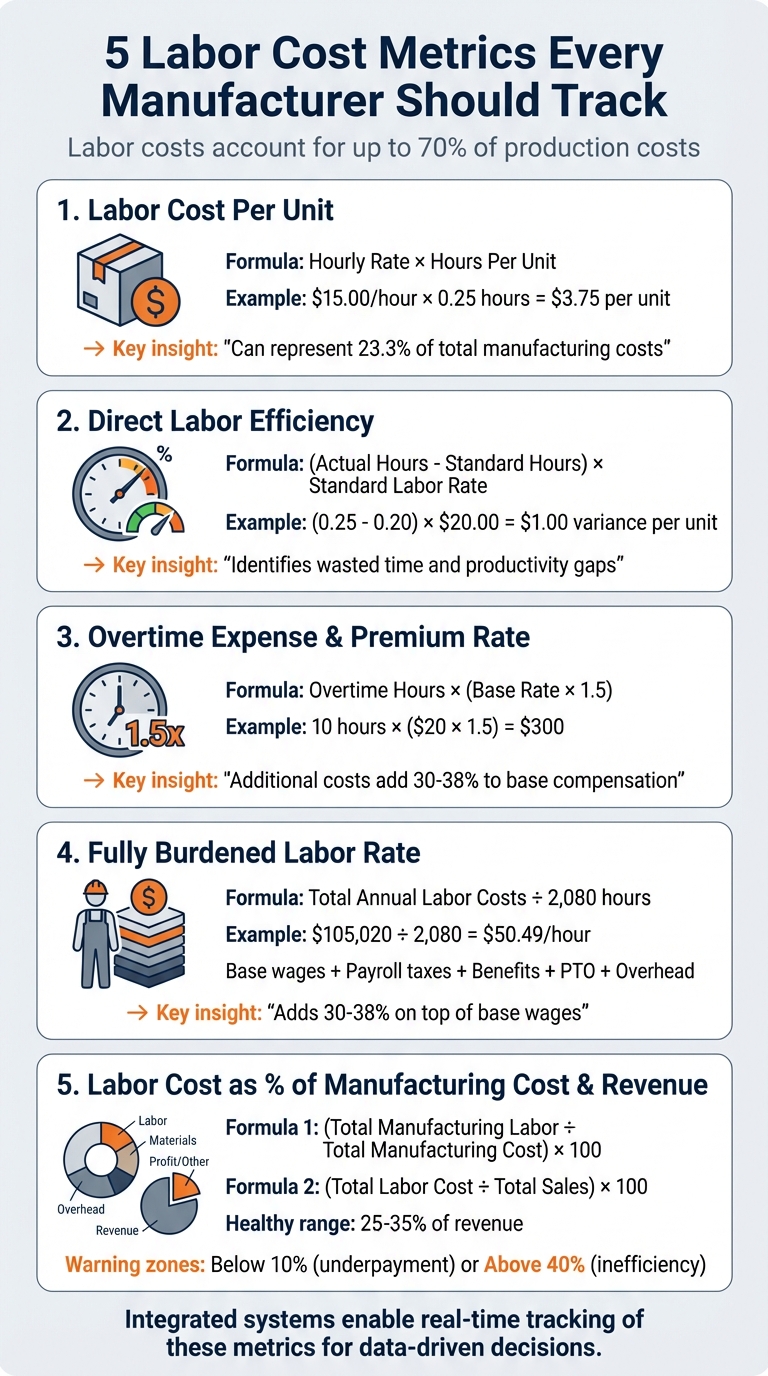
Labor costs are one of the largest expenses for manufacturers, often accounting for up to 70% of production costs. Tracking the right metrics can help you control expenses, improve efficiency, and protect your profit margins. Here’s a quick overview of the key labor cost metrics manufacturers should monitor:
5 Essential Labor Cost Metrics for Manufacturers
Labor cost per unit reflects the average amount spent on direct labor to produce a single finished product [1]. It accounts for direct production labor costs, including base wages and production bonuses, offering a clear view of labor expenses tied to each unit produced.
Here’s how you can calculate this essential metric.
To find labor cost per unit, follow these steps:
For example, if a manufacturer pays $15.00 per hour and it takes 0.25 hours to produce one unit, the labor cost per unit is $3.75. This figure might represent 23.3% of total manufacturing costs [1].
Labor cost per unit is a key indicator of manufacturing efficiency [1]. If this cost increases, it could signal issues like production delays, excessive downtime, or insufficient worker training. These inefficiencies directly affect cost of goods sold (COGS) and product pricing strategies [1].
"Inaccurate labor cost data risks mispricing products and eroding profit margins." - NetSuite [1]
To lower labor costs per unit, consider strategies like reducing overtime, cross-training employees to eliminate bottlenecks, and using digital tools for precise time tracking. Accurately measuring this metric lays the groundwork for improving labor efficiency throughout your operations.
Direct labor efficiency tracks how well your workforce is performing by comparing the actual hours worked per unit to a pre-set standard. It’s a way to spot where extra labor hours are driving up costs. When there’s a gap between the actual and standard hours, it signals wasted time and higher expenses.
Start by defining the standard labor hours per unit. Then, figure out the actual hours per unit by dividing total production hours by the total number of units produced. To find the efficiency variance, use this formula:
Efficiency Variance = (Actual Hours − Standard Hours) × Standard Labor Rate
Here’s an example: If the standard is 0.20 hours per unit at $20.00 per hour, but the team takes 0.25 hours, the efficiency variance is $1.00 per unit. Multiply that by thousands of units, and you’re looking at a significant cost difference. This calculation highlights where inefficiencies are creeping in, giving you the data you need to address productivity issues.
"A thorough understanding of labor costs helps companies establish metrics that can stand as productivity benchmarks against which to measure departmental efficiency." - Kristina Russo, CPA, MBA, NetSuite
Pinpointing inefficiencies - whether from a lack of training, equipment downtime, or poor scheduling - allows businesses to focus improvements exactly where they’re needed. This metric also ensures your job quotes and product pricing are based on actual labor performance, not just theoretical estimates. The result? Better control over costs and healthier profit margins.

Phoenix Strategy Group takes your business data and organizes it into actionable financial metrics, including direct labor efficiency. They use these KPIs to set realistic, achievable goals grounded in past performance. By conducting weekly reviews, they fine-tune targets and translate efficiency insights into daily, practical improvements.
Overtime expense refers to the additional pay given to nonexempt employees for working beyond 40 hours in a week. This extra compensation, known as premium pay, is usually calculated at 1.5 times the employee’s base hourly rate. According to the Fair Labor Standards Act (FLSA), most manufacturing workers are entitled to this time-and-a-half rate. Some states, however, have stricter rules, requiring overtime pay for any work exceeding 8 hours in a single day [1].
Here’s an example: If an employee earning $20 per hour works 10 overtime hours, their overtime pay would amount to $300 (10 hours × $30 per hour). On top of this, employers must factor in additional costs like payroll taxes, unemployment taxes, and increased workers’ compensation expenses, which can raise total compensation by 30% to 38% [1].
"Overtime is a significant revenue killer for manufacturing companies. If you rely on a small number of workers, you will pay some workers overtime which is almost twice their regular wages." – Shreyas Patil [5]
Frequent overtime can point to deeper problems, such as staffing shortages, production delays, or poor planning [1][3]. Over-reliance on overtime not only strains company finances but can also lead to overworked employees, increasing the risk of accidents, mistakes, and reduced morale. By analyzing overtime trends, manufacturers can decide whether it’s more cost-effective to continue paying overtime premiums or to address the root causes. Solutions might include hiring more workers, cross-training current employees, or improving production schedules. Tracking overtime expenses carefully also helps businesses integrate these insights into their overall financial strategies.
Phoenix Strategy Group incorporates overtime tracking into customized financial dashboards, offering a clear view of which departments or shifts are consistently over-scheduled. With access to real-time data and labor targets, they help distinguish between temporary seasonal demands and ongoing staffing issues. This allows businesses to make smarter decisions - whether it’s optimizing shift schedules, investing in cross-training, or hiring additional staff. By turning overtime data into actionable insights, Phoenix Strategy Group helps manufacturers control costs and improve efficiency.
The fully burdened labor rate represents the total hourly cost of employing a worker. Unlike direct labor costs, which only account for base wages, this rate includes every additional expense tied to employment - payroll taxes, health insurance, retirement contributions, paid time off, and allocated overhead costs[6]. In short, it provides a full picture of what it truly costs to employ someone.
In manufacturing, these extra expenses can add anywhere from 30% to 38% on top of base compensation[1]. Knowing these details allows businesses to calculate the real hourly cost of their workforce.
To determine the fully burdened labor rate, sum up all annual labor costs - base wages, payroll taxes, benefits, paid time off, and overhead allocations. Then, divide this total by the number of workable hours in a year, which is usually 2,080 for a full-time employee[6][8].
For example, consider a production supervisor earning $80,000 annually. Their additional costs might include:
This brings the total annual cost to $105,020. Divide that by 2,080 hours, and the fully burdened labor rate comes out to approximately $50.49 per hour[7]. This calculation is a key tool for making informed pricing and budgeting decisions.
"Many employers underestimate labor costs because they look only at direct wages. This leads to underpriced work, misaligned salary ranges, inaccurate headcount budgets, and missed profit margins." – SalaryCube[6]
Failing to account for the fully burdened labor rate can result in underpriced products, shrinking profit margins, and flawed financial planning. Tracking this metric is essential for creating realistic budgets, setting accurate prices, and making strategic decisions - whether you're comparing the costs of full-time employees versus contractors or planning to expand your workforce. Regularly updating this rate, especially when pay scales, benefits, or tax rates change, ensures you're always working with accurate data[6][8].
Phoenix Strategy Group incorporates fully burdened labor rates into detailed financial models, helping manufacturers gain a clear understanding of their total cost structure. By leveraging real-time market data and thorough cost checklists, they ensure that no expense is overlooked. This meticulous approach supports better decisions around headcount planning, pricing strategies, and resource allocation. With these rates integrated into financial dashboards, manufacturers can confidently forecast the financial impact of workforce changes and identify opportunities to maximize their labor investments.
This metric shows how much of your production costs and revenue are allocated to paying your workforce. Essentially, it reflects how reliant your production is on human labor compared to materials and equipment. There are two key calculations here: one compares labor costs to total manufacturing costs (which include direct materials, labor, and overhead), and the other compares labor costs to total sales revenue. These percentages help assess workforce efficiency and confirm whether your pricing strategy adequately covers labor expenses.
To calculate, start with your fully burdened labor costs and divide them by the relevant denominator.
Be sure to use consistent timeframes for accurate comparisons.
| Metric | Formula | What It Shows |
|---|---|---|
| Labor % of Manufacturing Cost | (Total Manufacturing Labor / Total Manufacturing Cost) × 100 | Highlights production efficiency and labor reliance[1] |
| Labor % of Revenue | (Total Labor Cost / Total Sales) × 100 | Indicates how much revenue is spent on workforce costs[1][9] |
Understanding these calculations is crucial for evaluating operational performance and efficiency.
"Labor typically represents the largest expenditure in most businesses, sometimes devouring 35% or more of total revenue." – Gary Anderson, Sage HCM[9]
A healthy labor cost range is typically between 25% and 35% of revenue to maintain profitability[9]. If labor costs exceed 40%, it could point to issues like overstaffing, inefficient processes, or underpricing. On the other hand, percentages below 10% might suggest underpayment or insufficient workforce investment[9]. Breaking these percentages down by product line or division can reveal specific areas that may be impacting overall profitability[1].
Phoenix Strategy Group incorporates these metrics into real-time financial dashboards. By tracking trends over time and benchmarking against industry standards, they help manufacturers identify when labor costs are rising disproportionately to output. This insight supports strategic decisions, such as adjusting pricing, investing in automation, or refining workforce planning. Their FP&A services link payroll data directly to production metrics, giving manufacturers a clear view of whether labor spending aligns with revenue goals and where process improvements could drive better results.
To effectively manage labor costs, integrating labor metrics into your financial systems is a must. This approach allows you to capture and analyze real-time data, ensuring every dollar spent on labor ties back to your operational and financial goals.
Start by connecting your ERP, payroll, and shop-floor data systems. ERP solutions consolidate production, inventory, and financial data, giving you a clear view of labor costs at every stage of manufacturing[1]. Seamless communication between these systems ensures labor data automatically feeds into financial reports without manual intervention.
Switch to digital time tracking that records hours by product rather than by employee. Cloud-based systems equipped with geofencing and GPS features eliminate the need for manual logs and help avoid overpayment for unworked hours[5][3]. Require employees to clock in for specific tasks, enabling your system to generate precise labor cost data. Make sure the platform captures fully burdened labor rates to reflect the true cost of labor.
"Integrated manufacturing software provides the visibility and tools to make data-driven decisions about labor cost management." – Kristina Russo, CPA, MBA[1]
This digital integration bridges operational data with financial insights. Mid-market accounting software with API capabilities can connect your general ledger to manufacturing systems[10]. This setup ensures payroll records are tied directly to specific work orders, giving you accurate direct labor costs per unit[1]. Real-time dashboards then display key metrics - such as labor utilization, efficiency rates, and overtime trends - allowing managers to quickly address production bottlenecks[1][4].
Phoenix Strategy Group specializes in building integrated systems that link payroll directly to production metrics through automated dashboards. Their Integrated Financial Model and Monday Morning Metrics give manufacturers instant insights into whether labor expenses align with revenue goals. These tools also highlight areas where process improvements could enhance profit margins. With the help of their fractional CFO team, manufacturers can design chart of accounts structures that clearly separate direct labor from indirect costs. This ensures financial reports accurately reflect true manufacturing expenses and translate labor metrics - like cost per unit and efficiency - into actionable insights in real time.
Labor costs make up about 70% of manufacturing expenses, making it essential to track metrics like labor cost per unit and direct labor efficiency [11]. Without keeping an eye on these numbers - such as overtime expenses, fully burdened labor rates, and labor costs as a percentage of manufacturing costs and revenue - you risk losing control over your largest expense category.
"If you're not measuring applied labor, you can't manage it effectively. This means you're missing the opportunity to identify and reduce the cost of inefficiency." – Rick Sovitzky, Chortek [2]
This highlights why keeping precise tabs on labor metrics isn't just a good idea - it’s critical for operational control. Beyond tracking costs, these figures play a key role in strategic decisions like pricing, capacity planning, and investments. For instance, using fully burdened labor rate data helps ensure accurate product pricing and protects profit margins. Meanwhile, analyzing overtime trends can uncover issues like poor scheduling or equipment downtime before they cut into profitability.
The real advantage lies in integrating these metrics into your financial systems for real-time updates. This kind of visibility lets you act quickly to address production bottlenecks, fine-tune staffing levels, and establish clear performance goals. Manufacturers who consistently monitor their labor metrics don't just keep costs in check - they create a culture of continuous improvement that fuels sustainable growth and long-term success.
For expert guidance on optimizing labor costs and driving growth, visit Phoenix Strategy Group.
To bring down labor costs per unit, manufacturers should start by calculating the fully burdened labor rate - this includes wages, taxes, and benefits. Doing so helps uncover hidden expenses that may be driving up costs. It's also essential to separate direct labor (like production floor tasks) from indirect overhead (such as management or quality assurance) to identify specific areas that need attention.
Cutting unnecessary overtime and fine-tuning shift schedules are straightforward ways to trim expenses. Flexible staffing options, like part-time positions or job-sharing, can also help reduce payroll costs while keeping operations efficient. On top of that, offering targeted training for underperforming employees can improve productivity, allowing more units to be produced in less time.
Another effective approach is adopting continuous improvement practices like lean manufacturing or automation. Streamlining workflows and integrating technology - such as robotics or advanced scheduling software - can significantly enhance efficiency. By boosting output and productivity, manufacturers can lower labor costs per unit without compromising on quality or production capacity.
Integrating labor cost metrics - like labor cost per unit, overtime expenses, and applied labor rates - into financial systems offers manufacturers a clearer view of one of their biggest expense categories. This integration helps managers track how labor costs influence product margins, compare actual spending to budgets, and pinpoint inefficiencies before they start cutting into profits.
When labor data becomes part of financial workflows, businesses can quickly identify patterns, such as unexpected overtime increases or staffing issues, and address them before they escalate. These metrics also play a key role in improving forecasting, budgeting, and strategic planning, leading to more precise profit estimates and smarter decision-making. In short, turning raw labor data into actionable insights helps businesses tighten cost control, streamline operations, and drive growth.
Tracking the fully burdened labor rate is essential for manufacturers as it gives a comprehensive picture of labor costs. This rate factors in more than just wages - it also includes taxes, benefits, and overhead expenses. In short, it reveals the true cost of labor for producing each unit.
Keeping an eye on this metric allows manufacturers to make smarter decisions about pricing, allocating resources, and managing costs. It also plays a key role in protecting profitability by ensuring that labor expenses are accurately reflected in production plans and financial forecasts.