Published on
March 28, 2026

Valuation multiples help compare companies in the renewable energy sector, which operates with varying financial structures and growth models. Here's what you need to know:
Quick Comparison:
| Company | Market Cap (2026) | EV/EBITDA Multiple | Focus Area |
|---|---|---|---|
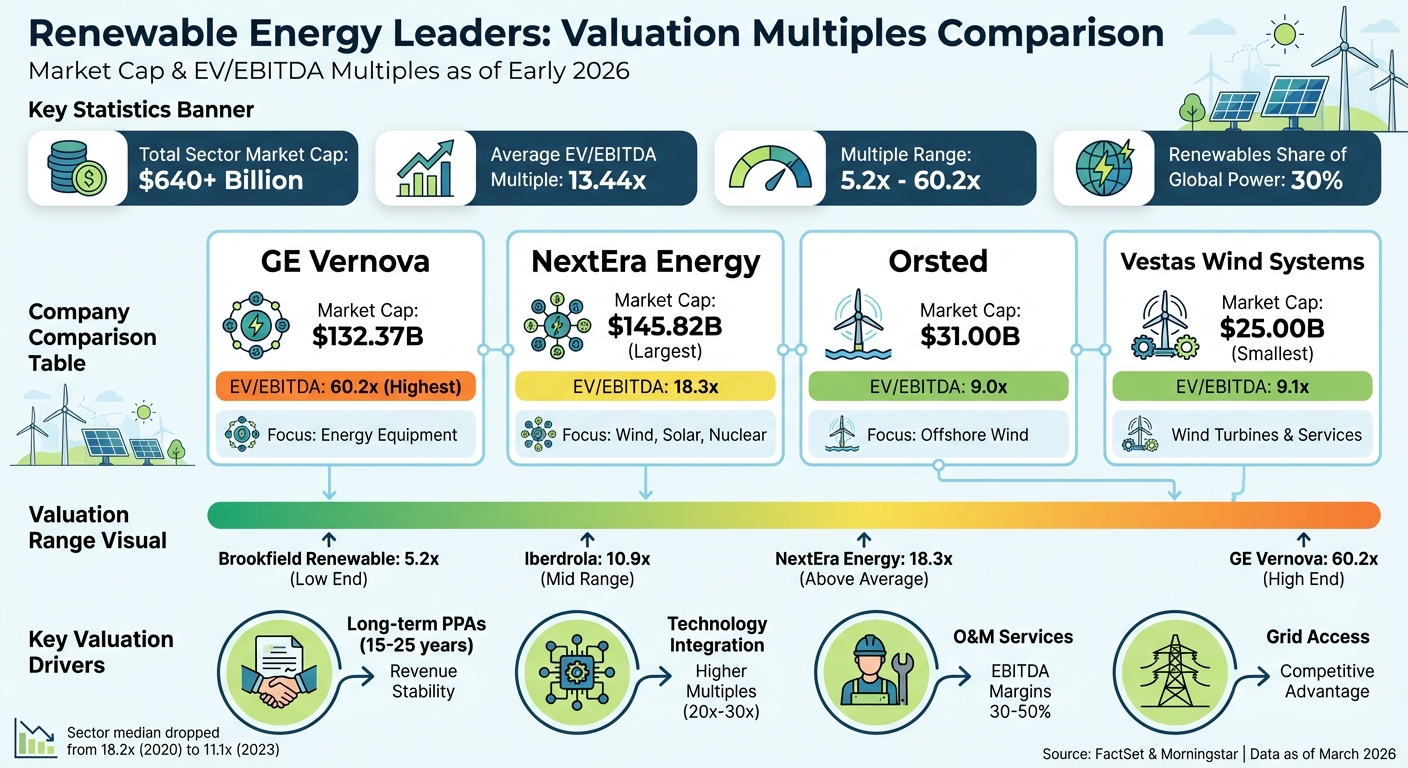
| GE Vernova | $132.37B | 60.2x | Energy Equipment |
| NextEra Energy | $145.82B | 18.3x | Wind, Solar, Nuclear |
| Orsted | $31.00B | 9.0x | Offshore Wind |
| Vestas Wind Systems | $25.00B | 9.1x | Wind Turbines & Services |
Valuations in this sector depend heavily on growth potential, revenue stability, and operational efficiency.
Top Renewable Energy Companies by Valuation Multiples 2026
To narrow down the field, we focused on large-cap companies with a market capitalization exceeding $10 billion. This approach ensures we're analyzing industry leaders with a strong market presence and ample liquidity. Such companies provide reliable benchmarks for investors and M&A professionals when assessing valuation multiples[6].
Our selection includes two types of players: pure-play renewable energy companies, which focus solely on clean energy, and diversified utilities, which maintain significant clean energy portfolios alongside other operations[6]. The companies span various subsectors, including utility-scale solar, onshore and offshore wind power, solar and wind turbine manufacturing, hydroelectric facilities, and renewable yieldcos[1]. To qualify, businesses had to be publicly traded on major global exchanges like the NYSE, NASDAQ, SSE, and HKEX[2][6]. As of early 2025, the combined market capitalization of the renewable energy sector topped $640 billion[6].
This selection method ensures our dataset captures the most prominent and influential market players, providing a solid foundation for valuation analysis.
Our analysis relies on data from FactSet and Morningstar, ensuring standardized financial metrics across all companies. This consistency is critical when comparing firms with varied fiscal year-ends and reporting standards[2][3][7].
We also validated forward-looking metrics using consensus NTM (Next Twelve Months) estimates[3][7]. Beyond financial metrics, we examined operational KPIs like Levelized Cost of Energy (LCOE), capacity factors, and the size of development pipelines measured in gigawatts[1]. This layered approach ensures the companies not only meet financial benchmarks but also demonstrate operational scale and efficiency.
To maintain consistency across different fiscal calendars, we calculated valuation multiples using Last Twelve Months (LTM) data[2][4]. Enterprise Value (EV) served as the numerator, which we calculated by adding market capitalization to net debt and subtracting cash and equivalents[3][7]. This method accounts for capital structure differences, a crucial factor in the debt-heavy renewable energy sector.
For EV/EBITDA, we divided Enterprise Value by EBITDA from the last twelve months. This standardization allows for direct comparisons between companies like GE Vernova, trading at 60.2x EV/EBITDA, and Iberdrola at 10.9x[2]. We also incorporated forward-looking multiples using 2026 and 2027 estimates to reflect the long-term nature of renewable energy project pipelines[2][7]. These calculations form the backbone of our comparative analysis, ensuring a reliable framework for evaluating valuation multiples.
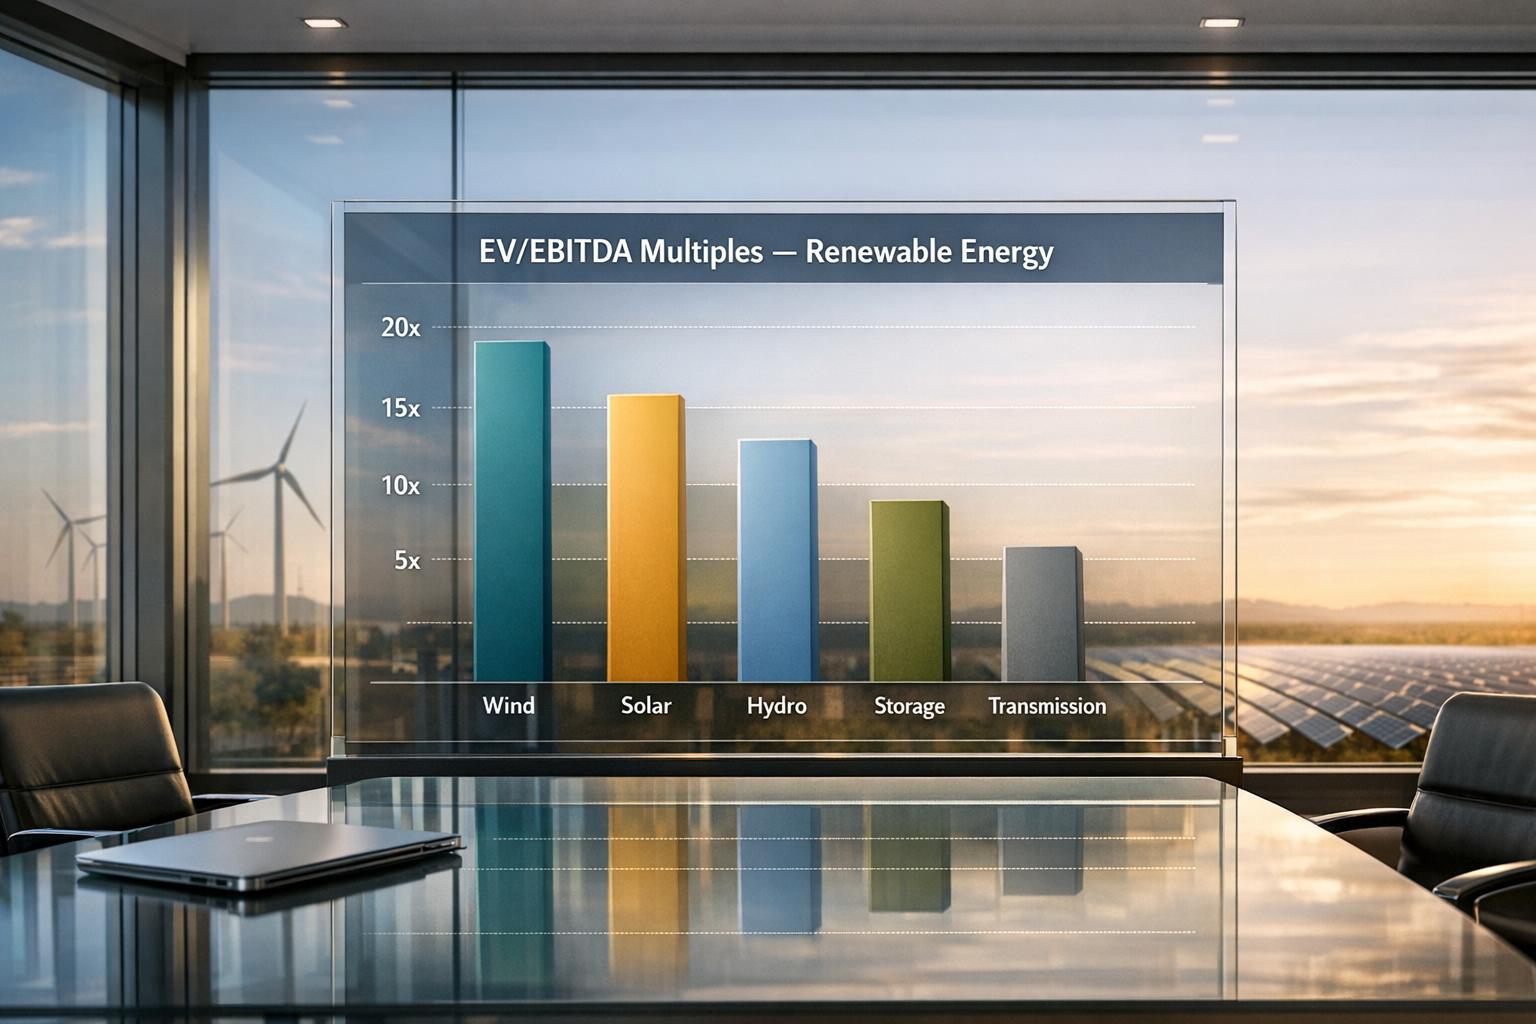
Valuation multiples in the renewable energy sector show significant variation, shaped by differing business models and growth trajectories. As of early 2026, the average EV/EBITDA multiple for profitable companies in the U.S. Green & Renewable Energy sector is 13.44x [8]. However, individual companies often diverge from this average based on their unique market positions and strategies.
NextEra Energy boasts a market capitalization of $145.82 billion and an EV/EBITDA multiple of 18.3x [2]. Its success lies in its diverse energy portfolio, which includes wind, solar, and nuclear generation. The company benefits from long-term power purchase agreements, which provide steady cash flow over 15–25 years [1]. Additionally, its early investments in grid interconnections help avoid delays caused by bottlenecks in infrastructure development.

Orsted, a leader in offshore wind energy based in Denmark, has a market capitalization of $31.00 billion and an EV/EBITDA multiple of 9.0x [2]. This relatively low multiple reflects the high upfront costs and capital intensity of offshore wind projects. Such projects are also vulnerable to supply chain challenges and rising interest rates, which can impact returns on these long-term investments [1].

Enphase Energy, known for its solar microinverter technology, holds a market capitalization of approximately $6.00 billion [2]. While its specific EV/EBITDA multiple is unavailable, the Electrical Equipment sector averages 24.59x [8]. Companies like Enphase, which focus on advanced technologies such as microinverters integrated with energy storage, often command multiples in the 20x–30x range [1][5]. The growing adoption of solar systems paired with battery storage has further elevated valuations for technology-driven firms.
Vestas Wind Systems, a prominent wind turbine manufacturer, has a market capitalization of $25.00 billion and an EV/EBITDA multiple of 9.1x [2]. This reflects the lower margins typical of equipment manufacturing (10–25%) compared to service-oriented businesses (30–50%) [1]. Although initiatives like the U.S. Inflation Reduction Act and the EU Green Deal are encouraging localized manufacturing and reshaping supply chains, manufacturers like Vestas still face risks from fluctuating commodity prices and competitive bidding. The company's valuation suggests that investors currently favor technology integrators over traditional equipment manufacturers.
These examples highlight the diverse valuation landscape within the renewable energy sector.
| Company | Market Cap (Early 2026) | EV/LTM EBITDA | Primary Focus |
|---|---|---|---|
| NextEra Energy | $145.82B | 18.3x | Wind, Solar, Nuclear |
| GE Vernova | $132.37B | 60.2x | Integrated Energy Equipment |
| Orsted | $31.00B | 9.0x | Offshore Wind |
| Vestas Wind Systems | $25.00B | 9.1x | Wind Turbines & Service |
GE Vernova's exceptionally high EV/EBITDA multiple of 60.2x [2] stands out, reflecting its strong position as an integrated energy equipment provider. The range of multiples, from Orsted's 9.0x to GE Vernova's 60.2x, highlights how investors prioritize growth potential and technological advancements over operational scale [6]. Companies that integrate innovative technologies into their operations tend to achieve higher valuations as the market increasingly values future growth and profitability.
Let’s take a closer look at the market forces shaping renewable energy valuations, building on the analysis of valuation multiples.
As of March 2026, EV/EBITDA multiples in the renewable energy sector vary widely, from 5.2x to 60.2x, depending on the business model [2]. This broad range reflects the diverse nature of companies in the industry. The median EV/EBITDA multiple for green energy firms hit a five-year low of 11.1x in Q4 2023, a notable drop from its peak of 18.2x in Q4 2020. This decline aligns with the shift from an era of "cheap and abundant" capital to a landscape marked by higher interest rates. Companies that integrate multiple renewable sources - like hydro, wind, and solar - often achieve multiples above 20x or even 30x EBITDA [5].
Several factors are influencing these valuation shifts:
These factors not only affect operational performance but also shape strategies for mergers and acquisitions.
The evolving valuation landscape is prompting shifts in investment and acquisition strategies. Corporate power purchase agreements (PPAs) have gained momentum, with tech giants bypassing utilities to secure large-scale carbon-free energy contracts [1].
Even with current multiples lower than their 2020 highs, optimism remains strong. Mark Lacey, Head of Global Resources at Schroders, commented:
"While there was euphoria in the sector in 2020, the fall in share prices since then has been healthy and the future is bright for clean energy, given the amount of money that needs to be invested in it" [5].
In 2023, global investment in green energy hit a record $135 billion - triple the amount invested in 2020.
The gap in valuations between tech-driven companies and traditional operators is also influencing M&A activity. Acquirers are increasingly targeting companies with integrated operations and specialized capabilities, such as tax equity structuring, expertise in grid interconnection, and advanced storage solutions. These features are more attractive than standalone generation assets. Public company valuations are also serving as benchmarks for emerging climate tech start-ups seeking funding or acquisition opportunities [5].
Fabrizio Arusa, ETF Specialist at Finesco, shared his perspective:
"We believe that the current rise in capital costs is only a temporary setback for the renewable energy sector, as growth prospects in this decade remain strong and financing is still widely available" [5].
As of March 27, 2026, EV/EBITDA multiples in the renewable energy sector show a broad range - from 5.2x for diversified asset owners like Brookfield Renewable Corp to 60.2x for equipment manufacturers such as GE Vernova. Established power generators like Ørsted (9.0x) and Vestas Wind Systems (9.1x) trade at more conservative levels, while high-growth developers and technology providers command much higher premiums [2].
The differences in valuation stem largely from revenue stability. Companies with long-term Power Purchase Agreements (PPAs) spanning 15–25 years enjoy predictable cash flows, which establish a solid valuation floor. In contrast, those exposed to spot market volatility face greater uncertainty [1]. Operations & Maintenance (O&M) services, with EBITDA margins between 30% and 50%, provide recurring revenue streams, while development and EPC (Engineering, Procurement, and Construction) activities typically yield lower margins of 8–15% on total project costs [1].
Operational efficiency across the sector remains impressive. Developers like ReNew report EBITDA margins of 66%, while Brookfield Renewable achieves an even higher 75% [3][4]. With renewable energy now contributing roughly 30% of the global power mix, the industry's maturity is evident [1]. Given the range of valuation profiles, stakeholders need tailored strategies to ensure sustainable growth in this evolving market.
These insights highlight the importance of fine-tuning valuation approaches in the renewable energy space. For investors, focusing on revenue sources and the stability of long-term contracts is essential. Instead of solely considering current operating capacity, assess the development pipeline in gigawatts at advanced stages. Developers with secured grid access gain a competitive edge, and the weighted average remaining life of PPAs offers a deeper understanding of cash flow reliability compared to raw revenue figures [1].
For business owners aiming to boost valuation, diversifying revenue streams is key. Integrating battery storage or O&M services can help capture higher margins and limit exposure to price volatility in merchant markets [1]. Metrics like the Levelized Cost of Energy ($/MWh) are critical for measuring long-term competitiveness. Additionally, the "Rule of 40" metric - which combines revenue growth and EBITDA margin - can be a helpful benchmark when comparing performance to industry leaders [1][4].
Investors should focus on companies strategically positioned to capitalize on market shifts. Trends such as pairing battery storage with renewable projects, regionalizing manufacturing due to policies like the Inflation Reduction Act, and increased corporate PPAs with major tech companies all support higher valuations [1]. Grid bottlenecks are also transforming interconnection queue positions into valuable assets, turning what was once a routine administrative step into a critical competitive advantage.
EV/EBITDA multiples in renewable energy can vary greatly, influenced by several key factors. These include the maturity of the technology being used, the stage of project development, the operational efficiency of the company, regulatory policies, and overall market conditions. Together, these aspects play a major role in shaping how companies in the renewable energy sector are valued.
Enterprise value (EV) is determined by combining a company’s market capitalization with its net debt. This figure represents the total value of the company, factoring in its debt while excluding cash. EV offers a more complete view of a company’s financial standing.
Investors should consider key metrics like EV/MW (Enterprise Value per Megawatt) to assess capacity and EV/Revenue (Enterprise Value to Revenue) for evaluating sales. Additionally, tools such as the levelized cost of energy (LCOE), discounted cash flow (DCF) models, and comparable transaction data can offer a clearer understanding of the financial and regulatory intricacies specific to renewable energy projects. These metrics help paint a more detailed picture of the sector's unique challenges and opportunities.