Published on
June 20, 2026

If I want a dashboard that helps me protect profit, I need to track revenue, direct costs, margins, overhead, and trend alerts by product, customer group, and sales channel.
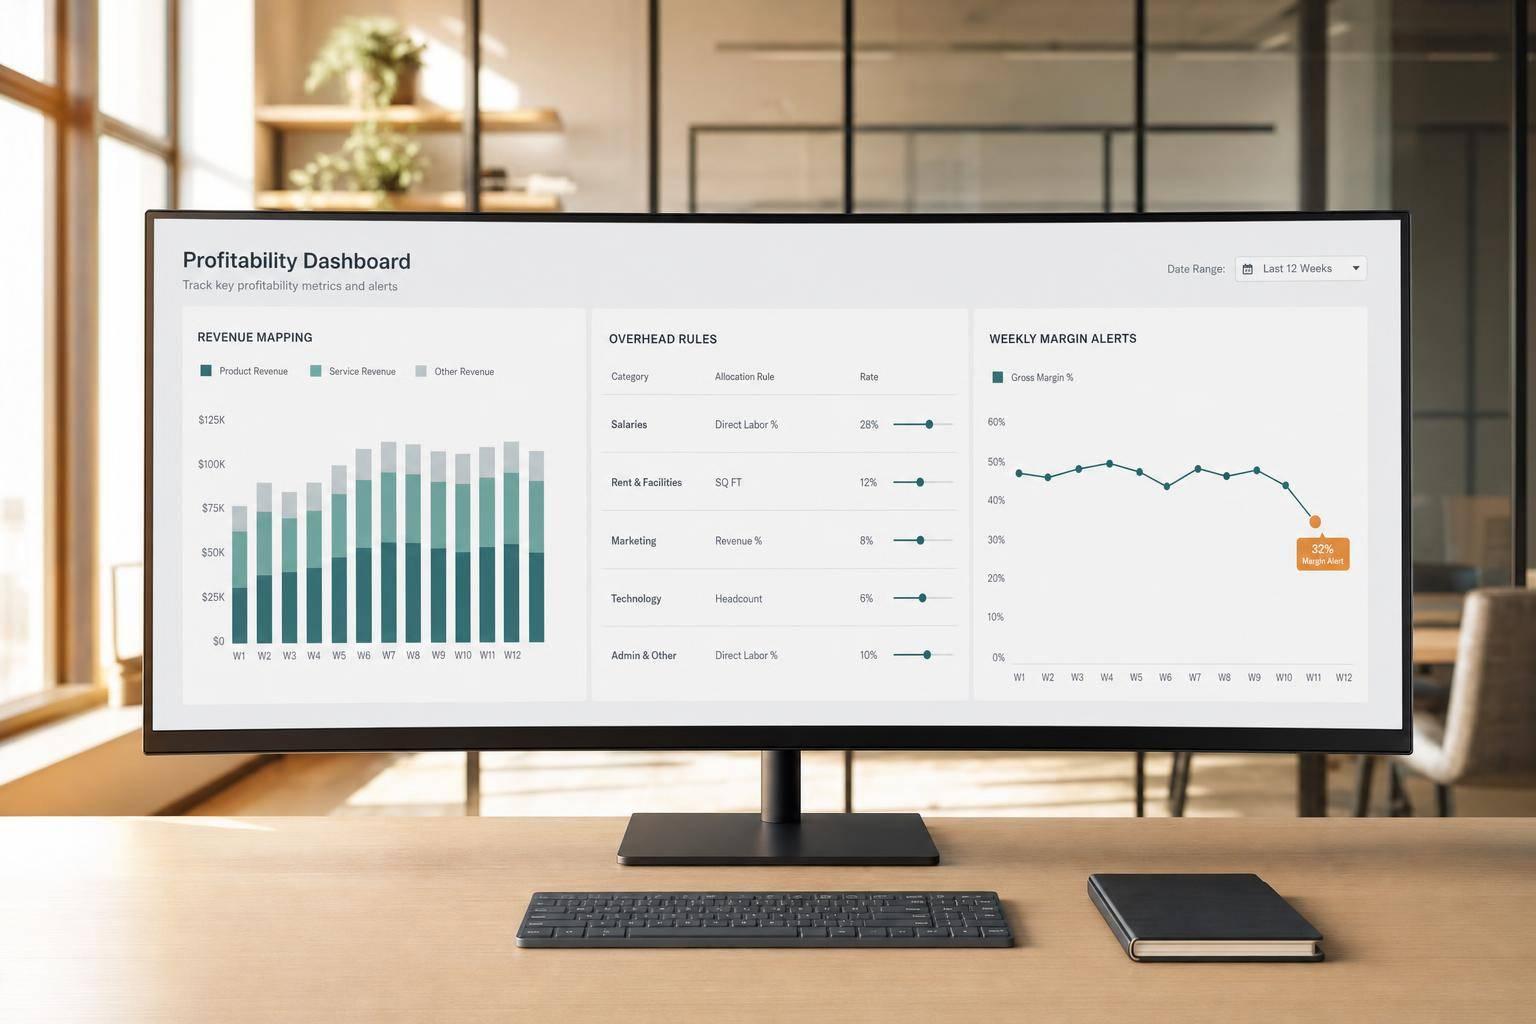
A good profitability dashboard is not just a sales report. It shows me:
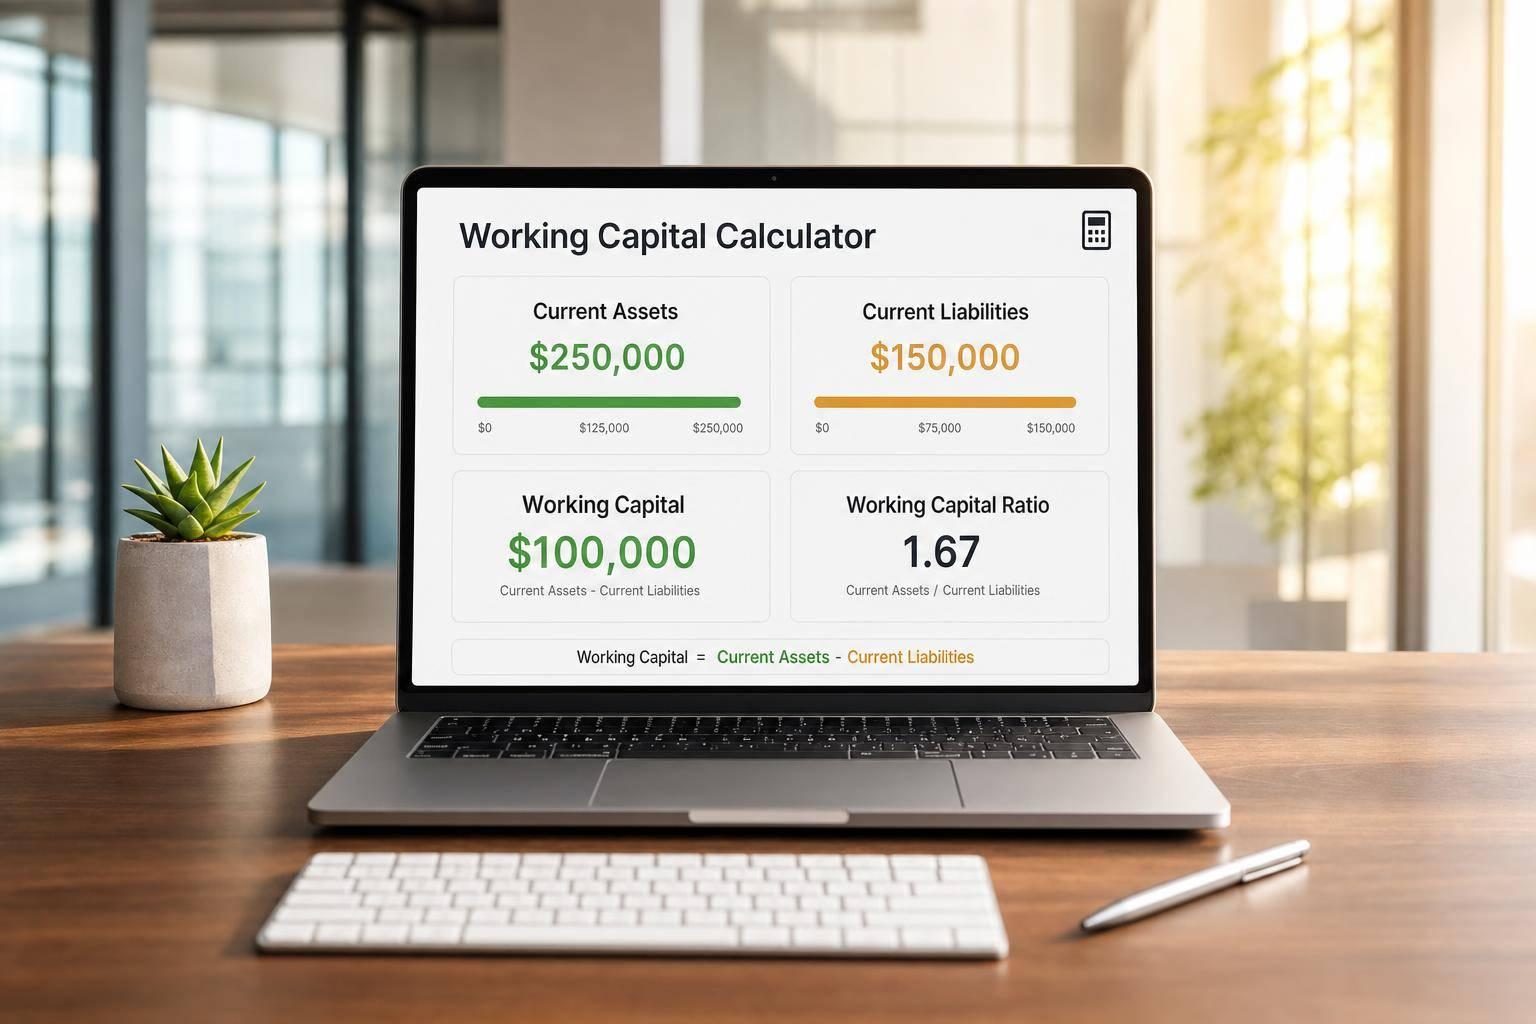
A few numbers matter most:
The article also makes one point clear: if I do not standardize revenue mapping, cost coding, ledger tie-outs, and overhead rules, the dashboard will mislead me. For example, if gross margin drops below 10.5% mid-month, I need to see it fast enough to fix pricing, mix, or ad spend before the month closes.
Here’s the short version:
This is the basic checklist I’d use to build a dashboard that is clear, timely, and ready for review.
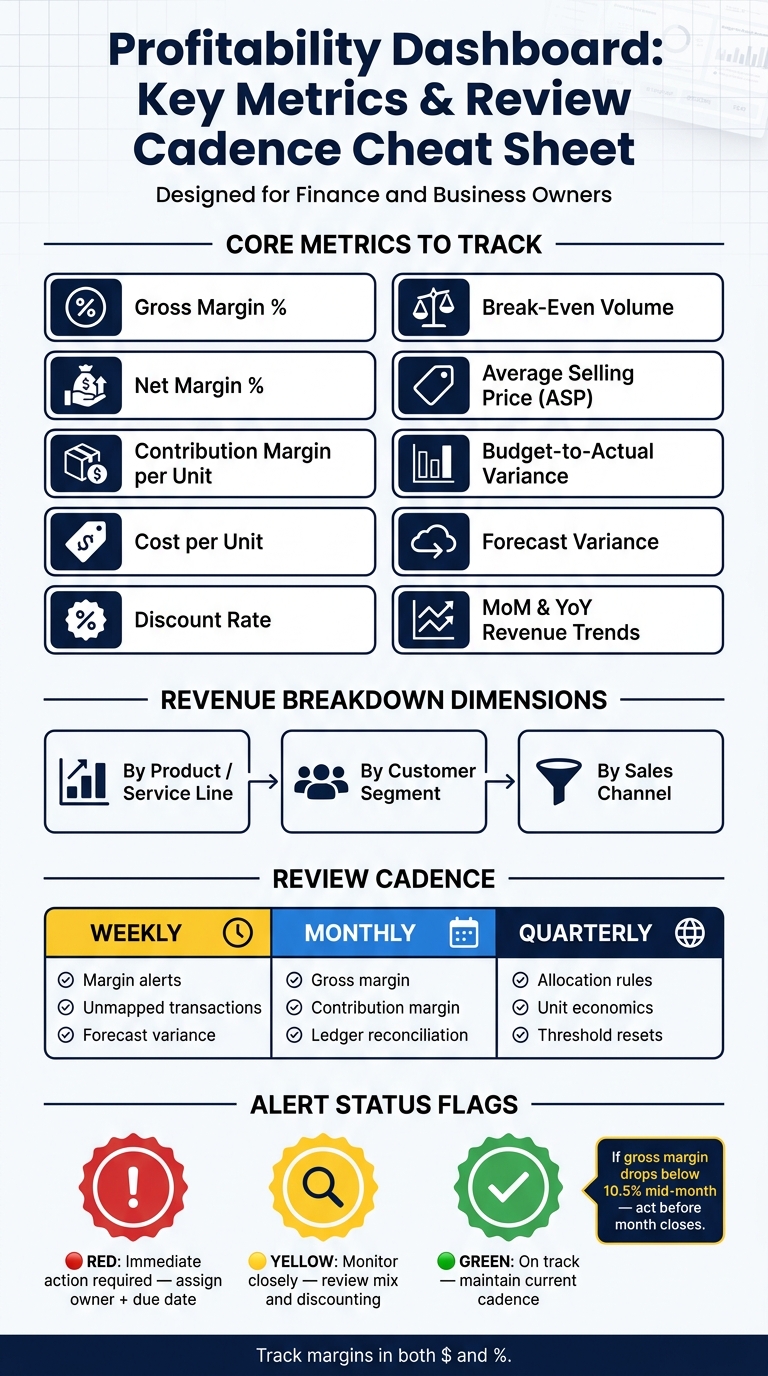
Profitability Dashboard: Key Metrics & Review Cadence Cheat Sheet

Build the dashboard on standard revenue accounts, cost tags, allocation rules, and clear system ownership. Get that structure in place first. Then you can track the revenue metrics that show where profit starts to move.
Line-level margin reporting only works when revenue and direct costs are tied to the right product or service. Start with the chart of accounts. Set up separate revenue and COGS accounts for each product, service line, or plan.
After that, tag every invoice line and every direct cost transaction with the right product or service tag. In QuickBooks Online, Xero, or NetSuite, that usually means turning on classes, departments, locations, or custom dimensions and making them required. Optional tags are a problem. When people skip them, unassigned costs throw off margin.
A simple habit helps here: review unmapped items every week.
Once revenue and direct costs are mapped, overhead allocation shows how much profit each line actually keeps. Shared costs should appear in the dashboard, but they need to flow through one steady allocation method. That way, gross margin by line stays comparable over time.
Use a logical driver for each cost pool. For example:
Write down each cost pool, driver, formula, and refresh cadence in an Overhead Allocation Policy. Most teams recalculate this quarterly or semiannually.
Your dashboard refresh cadence should match how fast decisions need to happen. Daily works for high-volume e-commerce or payment-heavy businesses. Weekly is often enough for B2B services or project-based models. Also set a clear data cutoff time, such as "data as of 11:59 p.m. ET the prior day", so everyone is reading the same numbers.
Connect the systems that feed product-level revenue, cost, and labor data so margin metrics stay current. Pull actuals from the GL, customer segments from CRM, subscriptions and fees from billing, labor from payroll, and shipping or project data from operations tools. Use ETL or ELT pipelines with a central data warehouse so every report runs on the same definitions.
Ownership matters just as much as setup. If no one owns the rules, numbers drift. If too many people own them, confusion creeps in.
Here’s the split that tends to work best:
A data dictionary or metrics catalog helps keep those definitions steady over time.
With sources connected and ownership assigned, the next checklist covers the revenue metrics to monitor first.
Once your systems talk to each other and each metric has an owner, the next job is simple: know which revenue numbers deserve your attention.
Start with total revenue by product or service line. Then break it out by customer segment and channel.
That’s where patterns start to show up. You can see where low-margin sales tend to pile up and which parts of the business are doing the heavy lifting.
After you split revenue into segments, look at the inputs that move profit, not just top-line sales.
Track units sold or, for service businesses, project count. Pair that with average selling price (ASP). If revenue goes up while ASP drops, that usually means volume is doing more of the work than pricing.
Discount rate - total discounts ÷ net sales - takes a direct bite out of profit and often gets overlooked [1]. If you sell on a recurring model, track new revenue, expansion revenue, contraction revenue, and churned revenue. That makes it easier to see whether growth is helping margin or watering it down.
Use month-over-month to track the rhythm of the business. Use year-over-year to filter out seasonality. Then use budget-to-actual and forecast variance to tell the difference between a missed plan and a normal fluctuation [2].
These revenue signals set up the cost and margin checks in the next checklist.
Now track the costs that decide whether revenue turns into profit.
Track the direct costs tied to each product or service line: materials, packaging, direct labor for production or service delivery, and shipping or fulfillment. Keep those numbers in plain view so you can see unit economics over time instead of guessing.
Show overhead as a ratio to net sales. Use overhead ÷ net sales to spot overhead creep as the business grows.
Show margin metrics in both dollars and percentages. That way, leaders can compare product or service lines without size skewing the picture.
Gross margin % - calculated as (Net Sales – direct costs) ÷ Net Sales - is the first check [1]. It shows whether the business model works before overhead enters the picture [1].
Then add net margin to show what’s left after all operating costs. Net margin % = net income ÷ net sales.
Also track contribution margin per unit, which equals net sales per unit minus direct costs per unit [1].
Compare the whole business with your top revenue lines to catch mix shifts [1]. If sales are up but margin is down, start by looking at product mix, discounting, or rising fulfillment costs [1].
Cost per unit and contribution margin per unit show whether more volume actually improves profit [1]. Don’t scale until contribution margin per unit stabilizes [1].
Track margin weekly. If gross margin drops for two straight weeks, review mix and discounting right away [1].
Once your metrics are set, the final job is simple: keep them reliable. A profitability dashboard only works when the numbers tie back to the source and the review schedule doesn't drift.
Use three review layers built around the profitability metrics covered in this article:
Each month, reconcile dashboard margins to the general ledger so product and service-line profitability stays credible [3]. And every metric needs a documented formula that stays fixed unless leadership is clearly told about a change [4].
Use red, yellow, and green status flags so the team can spot exceptions fast [3][4]. If a metric shows red or yellow, assign an owner and a due date right away.
Start with 5 to 7 primary KPIs that match your company’s goals and current stage. Put the main numbers front and center: revenue trends, gross margins, EBITDA, and cash runway.
Keep secondary metrics, like product-line profitability, marketing spend, or regional breakdowns, in drill-down views so the main dashboard doesn’t get crowded. A simple filter helps here: the “So What?” test. If a change in a metric wouldn’t lead to action, it probably doesn’t belong on the main view.
Move with a rhythm that favors speed and action, not old-school monthly reporting.
Yes, monthly financial statements still matter. But if you're running a growth-stage company, you need real-time dashboards and a weekly review of key metrics like gross margin and EBITDA.
Some numbers need even closer attention. Cash position and liquidity, for example, are best watched daily. Those figures can shift fast, and waiting until month-end is just too late.
A simple rule helps here: if a metric doesn’t trigger a decision or a deeper look, it probably doesn’t belong on your real-time dashboard.
No single margin metric matters most for every business. The right one depends on your goals and where you are in your growth stage.
Gross margin is the main starting point because it shows how your core operations are performing. But if you want a better read on profitability, it also helps to track contribution margin and EBITDA margin.