Published on
April 17, 2026

Most professional services firms lose money on projects because they spot issues too late. Real-time tracking changes that by providing up-to-date financial data, helping you adjust budgets, reallocate resources, and avoid over-servicing. Firms using automated systems recover 15%–40% more billable hours and improve project margins by 3%–5%.
Switching to real-time tracking is essential for firms aiming to improve profits, manage resources better, and meet client expectations. Here's how you can make it work for your business.
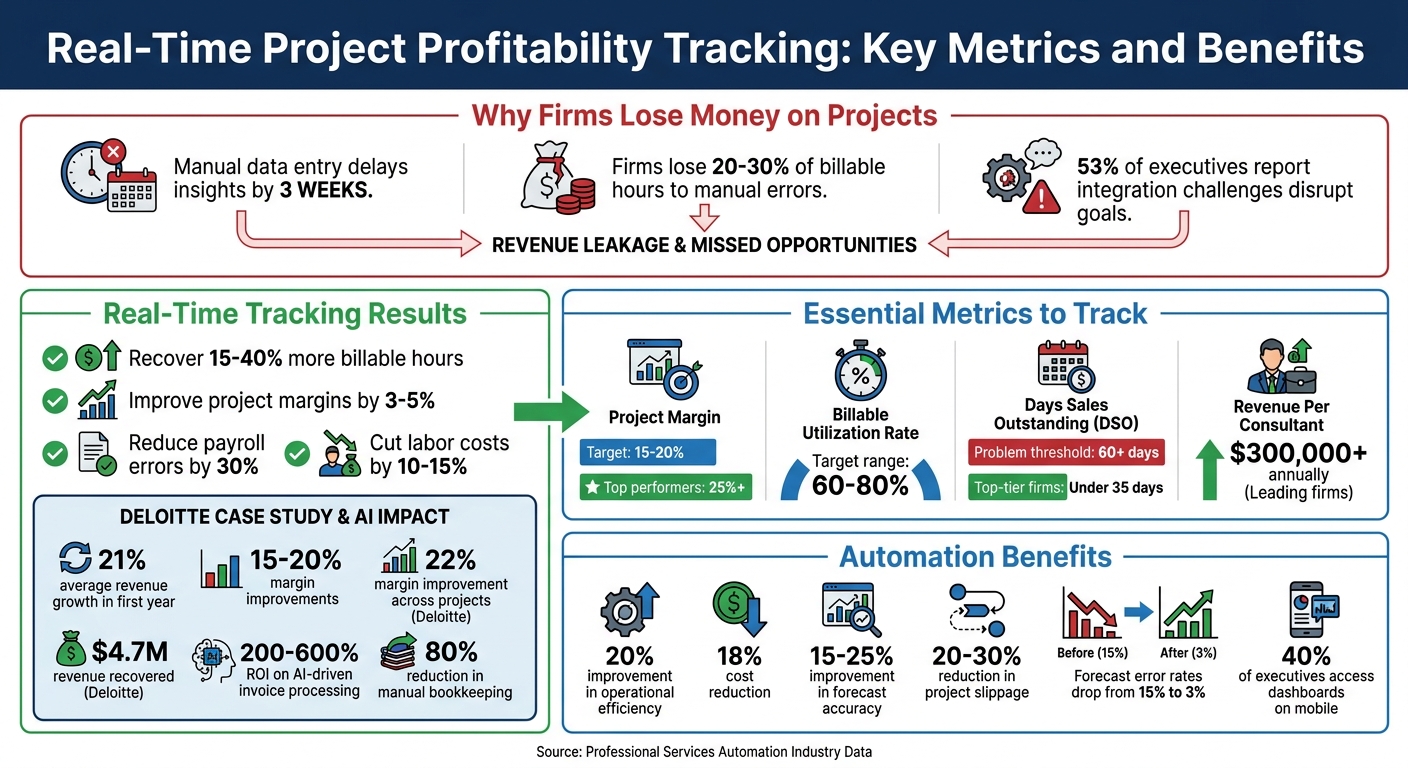
Real-Time Project Profitability Tracking: Key Metrics and Benefits for Professional Services Firms
Tracking profitability in real time starts with automating data flows to eliminate delays and reduce manual errors. This approach creates a solid foundation for making timely decisions that help keep project margins on track.
The first step to real-time profitability tracking is cutting out manual data entry across key systems like time tracking, billing, and accounting. When platforms operate in silos, it leads to manual reconciliations that can introduce errors and delay insights by as much as three weeks [1]. By directly integrating job management software with accounting tools such as Xero or QuickBooks, you can ensure financial data moves seamlessly across your business.
Professional Services Automation (PSA) platforms make it easier to connect time tracking, project management, and billing systems [3]. With PSA tools, labor costs update immediately as employees log their hours. This means project managers can see the financial impact on budgets in real time, rather than waiting for end-of-week reconciliations [1]. For companies relying on separate tools, Configure, Price, and Quote (CPQ) software can help by standardizing pricing models and improving estimation accuracy using historical project data [3].
Expense allocation should also be automated. Systems can flag transactions that aren’t yet tied to a specific project - referred to as "unallocated project amounts" - to make sure nothing slips through the cracks. Syncing vendor bills and outstanding expenses gives project managers a full view of liabilities and their effect on margins. Additionally, mobile time entry tools reduce delays by syncing labor hours with project reports as soon as they’re logged.
This level of integration creates the groundwork for more advanced systems, such as Phoenix Strategy Group's Weekly Accounting System.
Phoenix Strategy Group takes real-time synchronization a step further with its Weekly Accounting System, tailored for growth-stage professional services firms. Instead of waiting for monthly financial closes, this system processes accrual accounting and revenue reconciliation every week. The result? Profitability metrics that reflect the latest project conditions, keeping teams informed and agile.
Keeping an eye on the right metrics helps you catch problems early. Successful firms focus on both lagging indicators (past performance) and leading indicators (future trends) to stay ahead.
At the heart of profitability tracking is the project margin. This metric reveals whether individual projects are profitable after factoring in labor, contractor costs, and project-specific expenses. Aiming for a net project margin of 15–20% is common, but top-performing firms often hit 25% or more [4].
The billable utilization rate measures how much of your team’s available time is spent on client work that generates revenue versus non-billable tasks like admin work or training. Most professional services firms set their targets between 60–80% [5]. Comparing planned effort to actual effort in real time can help spot estimation errors before they start eating into your margins.
"Lagging KPIs tell you the score. Leading KPIs tell you whether you'll win the next game." - Kailash Ganesh, Author, Rocketlane [4]
Another critical metric is Days Sales Outstanding (DSO), which tracks how quickly you collect payments after invoicing. A DSO over 60 days often signals operational issues, while top-tier firms keep it under 35 days [4]. Similarly, revenue per consultant reflects how billing rates, project types, and delivery efficiency combine. Leading firms achieve over $300,000 annually per consultant [4]. Lastly, the scope creep rate measures how much the actual work deviates from the original Statement of Work.
Leading indicators, such as utilization forecasts for the next 30 days or milestone completion rates in the second week of a project, can predict problems 6–8 weeks ahead [4]. These early warnings allow firms to act before projects spiral out of control.
Phoenix Strategy Group takes these metrics a step further, turning raw data into actionable insights on a weekly basis.
Phoenix Strategy Group has developed a system called Monday Morning Metrics, which helps growth-stage firms stay aligned and responsive by tracking these profitability indicators weekly. Every Monday, firms compare planned budgets with actual spending to quickly spot any overages [6].
A key focus of the system is the Labor Efficiency Ratio (LER), which ties payroll directly to gross profit. This metric highlights how effectively your team’s work translates into profit [6]. By also monitoring unit economics - such as lifetime value (LTV), customer acquisition cost (CAC), and revenue per customer - the system identifies underperforming accounts or projects that could be dragging down firm-wide profitability [6].
Weekly reviews ensure forecasts are turned into actionable goals. This keeps everyone on the same page about what needs to happen to maintain profitability [7]. Instead of treating budgets as fixed, firms update them weekly based on real-time data and market conditions. This dynamic approach helps control costs and reduce waste before they escalate into larger problems.
"As our fractional CFO, they accomplished more in six months than our last two full-time CFOs combined. If you're looking for unparalleled financial strategy and integration, hiring PSG is one of the best decisions you can make." - David Darmstandler, Co-CEO, DataPath [7]
Behind the scenes, Phoenix Strategy Group uses robust data engineering tools, including ETL pipelines and data warehousing, to ensure clean and accurate data feeds into their dashboards [7]. This infrastructure supports an Integrated Financial Model, where finance and revenue operations work together seamlessly. By breaking down silos, firms can turn their data into a competitive edge that drives growth.
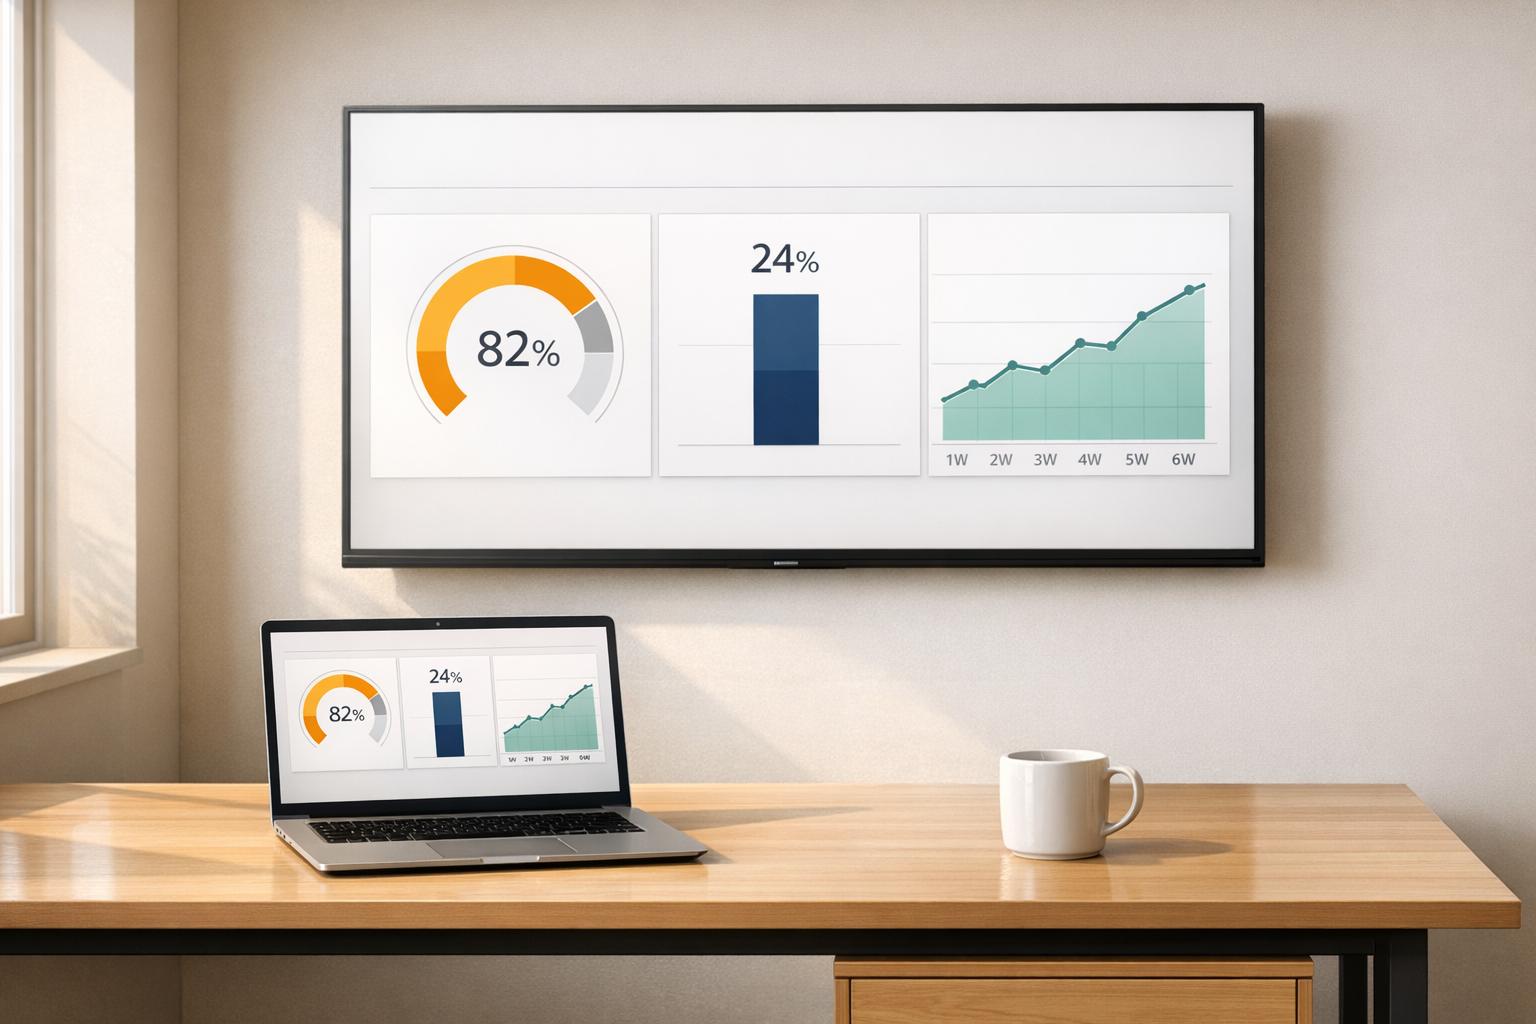
When working with real-time data, dashboards need to be designed for clarity and quick interpretation, especially when tracking project profitability. To avoid overwhelming users, it's best to limit each dashboard view to 4–6 key metrics. For professional services firms, metrics like project margin and utilization rate should be prominently placed at the top. Use the middle section for trends and reserve the bottom for alerts that are easy to scan [8].
Keep the design clean by using a restrained color palette - ideally 5–7 colors. For instance, green can signal strong performance, yellow can indicate caution, and red can highlight issues requiring immediate attention. This approach ensures patterns stand out without creating visual clutter [8]. For data visualization, line charts work well for showing trends over time, while bar charts are ideal for comparing profitability across clients or projects.
A great example comes from Deloitte Consulting, which rolled out Power BI dashboards for a professional services client in Q1 2024. By integrating live QuickBooks data and building predictive models for billable hours, the team - led by FP&A Director Maria Lopez - reduced the reporting time for project profitability from two weeks to real time. The initiative led to a 22% improvement in margins across 150 projects and recovered $4.7 million in revenue by identifying underperforming projects early [9].
Dashboards should also be mobile-friendly and feature drill-down capabilities for deeper analysis. This is particularly important because 40% of executives access dashboards on their phones [9]. The top-level view, however, should remain simple enough to grasp at a glance.
Once these clear visuals are in place, predictive FP&A tools can take insights a step further, turning real-time data into actionable forecasts.
Dashboards provide a snapshot of the present, but predictive FP&A tools help anticipate what’s ahead. These tools allow businesses to run "what-if" scenarios, such as forecasting the financial impact of a 10% increase in billing rates. Platforms like Adaptive Insights, Anaplan, and Power BI use time-series forecasting to predict future project margins based on historical performance [8]. For example, they can analyze variables like team size, billing rates, and past scope changes to generate forecasts with confidence intervals, such as "Q3 margin forecast: 28% ±5%" [9].
In 2023, Accenture demonstrated the power of these tools by using Tableau to create real-time profitability dashboards for its managed services division. By connecting directly to SAP, they boosted the average project EBITDA from 18% to 27% within six months across 200 engagements. The key to their success was feeding at least 12 months of clean historical data into regression models, which improved forecast accuracy by 15–25% [9].
Similarly, Phoenix Strategy Group uses FP&A tools as part of its Integrated Financial Model. This system combines real-time data with predictive scenario planning, helping growth-stage firms analyze scenarios like the effect of a two-week project delay or a 10% billing rate increase on overall profitability [6]. According to Gartner, organizations that adopt predictive FP&A dashboards see a 20% improvement in forecast accuracy, with error rates dropping from 15% to just 3% [9].
Automated alerts are another essential feature. For instance, if a system predicts that project costs will exceed 80% of revenue within the next week, it should immediately notify the team through email or Slack [9]. Proactive notifications like these can reduce project slippage by 20–30%, giving firms the chance to adjust resources, renegotiate terms, or revise scopes before profitability takes a hit.
Real-time data becomes impactful when it leads to informed actions. A key step is to compare quoted versus actual time and costs at the task or phase level. This helps flag potential overspending before the budget runs out [1]. For example, if a 40-hour project phase is trending toward 55 hours halfway through, it's crucial to step in right away.
Tracking in real time can also highlight resource mismanagement. For instance, if senior team members are handling tasks that junior staff could complete, it can hurt profit margins [1]. Similarly, keeping an eye on subcontractor hours enables teams to reassign internal resources or adjust the project scope if those hours exceed expectations.
Another game-changer is identifying unbilled work. Automated tracking can recover missed billable hours by capturing short, overlooked tasks, potentially increasing profitability by 15–40% [2]. Companies like Momentum Studio and Impulse Lab have already seen major improvements in both profitability and billing accuracy using this method [2].
Weekly profitability reviews are equally important. These reviews help catch scope creep early, allowing teams to realign client expectations and adjust deliverables before profits take a hit [1]. As WorkflowMAX aptly states:
"If you don't know your numbers, you don't know your business" [1].
These insights pave the way for a more cohesive financial strategy.
Phoenix Strategy Group builds on these real-time insights with its Integrated Financial Model, which serves as a "Mission Control" for professional services firms. This centralized system combines strategic decision-making with project tracking [6].
The model replaces outdated spreadsheets with AI-powered cloud forecasting, enabling faster decisions and reducing liquidity risks. By merging operational metrics with financial data - an approach inspired by Lean CFO principles - it identifies inefficiencies and eliminates waste in project workflows. It also benchmarks key metrics like LTV:CAC and gross margin targets while supporting 13-week rolling forecasts to safeguard cash flow and improve decision-making [6].
Automation plays a major role here. Streamlining financial workflows can cut manual bookkeeping by about 80%, and AI-driven invoice processing can deliver a return on investment of 200–600% within the first year [6].
As businesses grow, managing financial data becomes increasingly complex. In fact, more than 90% of firms encounter hurdles caused by fragmented systems [10]. To overcome these challenges, companies need a solid data infrastructure capable of handling multiple projects, teams, and clients without disruption.
Modern data engineering offers a way to remove manual inefficiencies. Tools like Apache Airflow, Dagster, and Prefect can automate data pipelines, consolidating information from time tracking, billing, and bookkeeping systems into a unified platform [10][12]. This eliminates the chaos of scattered data and creates a reliable "single source of truth."
Real-time tools such as Apache Kafka and Flink enable immediate responses to issues like budget overruns. By implementing these solutions, firms can improve operational efficiency by up to 20% while cutting costs by 18% [10][11].
For deeper insights, cloud data warehouses like Snowflake, BigQuery, and Databricks offer the speed and flexibility needed to analyze both historical and real-time profitability trends [11][12]. Additionally, tools like dbt help enforce best practices like version control, testing, and documentation, ensuring data remains accurate as operations scale [12].
These strategies are essential for maintaining financial accuracy, especially during major milestones like mergers and acquisitions (M&A) or enterprise-level scaling.
A scalable data infrastructure is particularly valuable for firms preparing for acquisitions or securing funding. Reliable financial tracking can recover 20–30% of billable hours lost to manual errors, ensuring accurate valuations and instilling confidence in investors [2].
Phoenix Strategy Group’s Enterprise plan combines M&A advisory services with advanced financial tracking. This includes enterprise-level reporting features, such as "Cost to complete" and "Committed cost" analyses, which are critical for predicting final project costs and managing complex portfolios during growth [14]. These reports provide the transparency and operational clarity that buyers and investors demand during due diligence.
Firms that prioritize profitability management often see revenue grow by an average of 21% in the first year [13]. The Enterprise plan’s Integrated Financial Model helps businesses identify revenue leaks and underutilized resources before they impact margins. This proactive approach not only optimizes valuations but also demonstrates operational excellence to potential buyers or investors.
By combining cutting-edge data engineering with M&A expertise, growth-stage firms can position themselves for success. As Robert Yuen, CEO of Monograph, puts it:
"Profitability isn't luck: it's a system" [13].
To make the most of real-time insights, it's crucial to tackle implementation hurdles head-on. One major issue? Data latency, which can derail profitability insights. If financial data takes days - or even weeks - to reach decision-makers, the chance to make timely adjustments is gone. The main reason behind this lag? Legacy systems that weren’t built to sync with today’s cloud-based platforms.
In fact, 53% of executives say integration challenges between new and old systems have disrupted their goals [15]. A promising solution is Change Data Capture (CDC). This tool syncs legacy systems with modern platforms by capturing row-level changes and publishing them as events. It ensures a steady, low-latency stream of updates without overloading transactional databases [16][17].
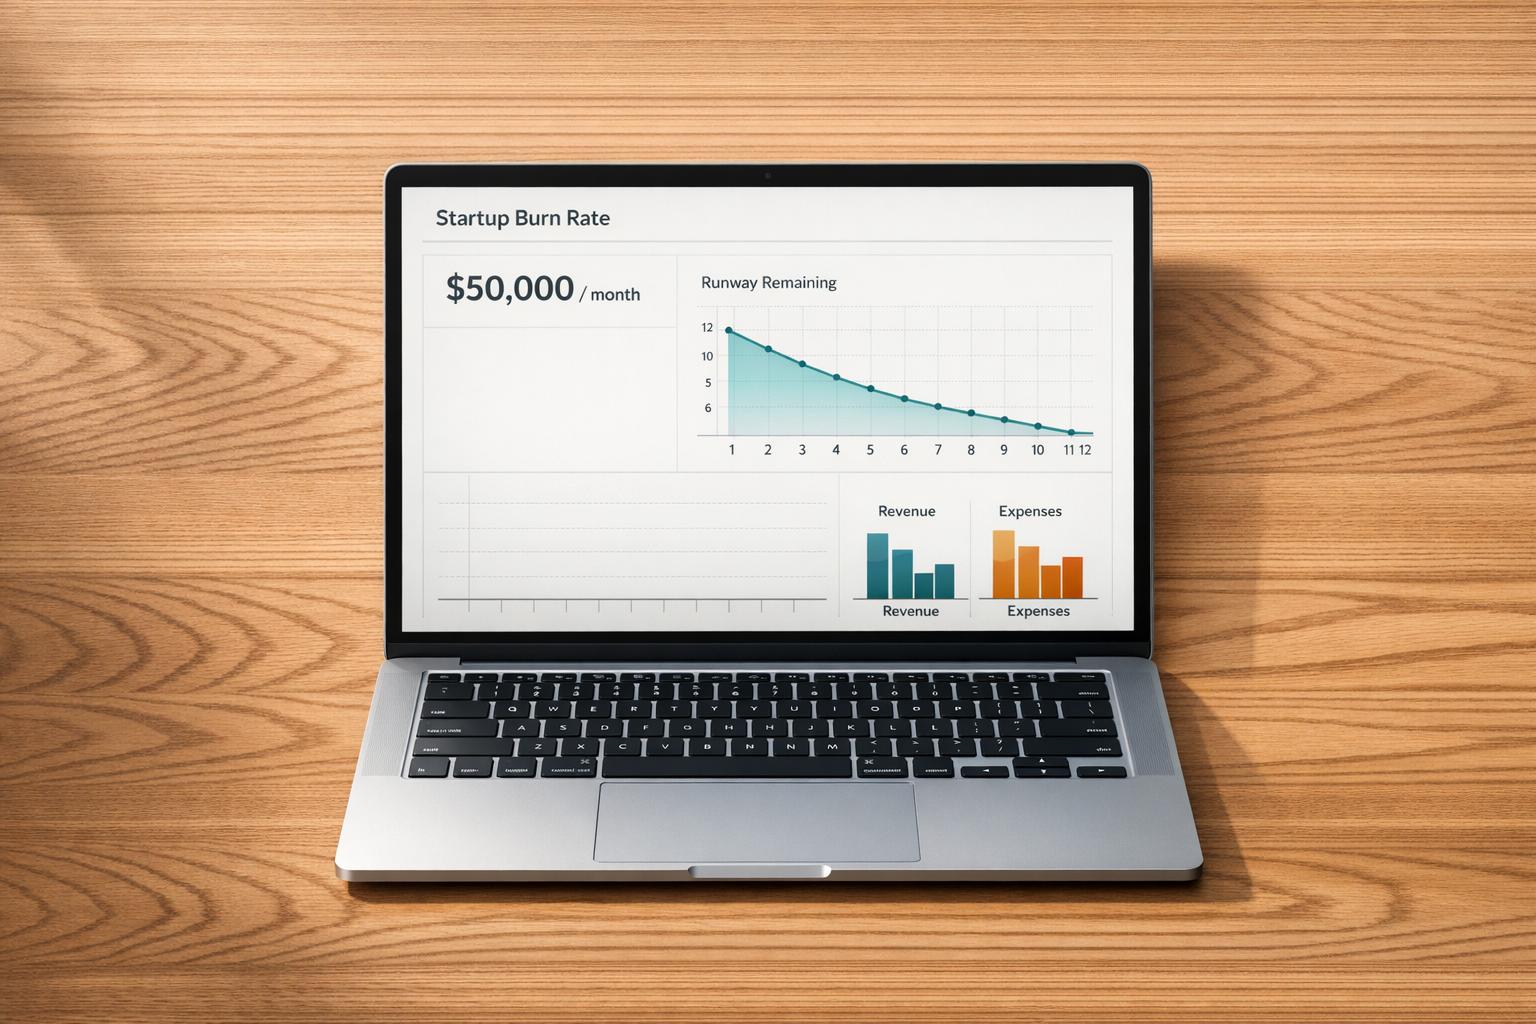
For professional services firms, switching to daily digital time tracking can eliminate the delays caused by manual reporting. When field teams log hours and expenses through mobile apps each day, finance teams gain near-instant insights into project burn rates. This simple change can reduce payroll errors by 30% and trim labor costs by 10–15% through better resource management [19].
Another common challenge is data quality - think missing entries, duplicate records, or inconsistent formats. Automated tools for data profiling and schema enforcement can ensure that only clean, consistent data makes it into dashboards [15][16]. Schema registries with compatibility rules also help prevent downstream issues [17]. As Chandni Sinha, Product Marketing Manager at IBM, explains:
"Data integration is the circulatory system of your business. If it's slow, fragmented or fragile, every business initiative suffers, from AI to analytics to customer experience" [15].
Adding historical context alongside real-time data can further improve the quality of insights.
Real-time insights alone can leave gaps in understanding. For example, a project might appear profitable today but could be underperforming compared to similar work last quarter. Horizontal analysis, which compares current performance to historical benchmarks, helps reveal whether revenue growth is accompanied by stronger margins - or if rising costs are eating into profits [20][22].
To get a clear picture, normalize data by removing one-time events like legal settlements or asset sales to establish a reliable baseline [20]. Pair real-time financial metrics with historical data, such as past pricing changes or shifts in customer demographics, to better understand margin fluctuations [21]. This method supports variance analysis, which flags discrepancies between actual outcomes and budgeted expectations [20].
Hybrid architectures make it easier to balance real-time processing with cost-effective batch reporting for non-urgent tasks [18]. This approach allows firms to stay responsive while keeping expenses under control. Companies adopting this strategy often achieve 15–20% margin improvements by identifying and addressing profit erosion early [19].
To ensure consistency, align real-time data feeds with the same regulatory standards - such as GAAP or IFRS - used for historical records [20]. Monthly variance reviews that compare real-time data against historical budgets can uncover trends and allow for mid-project adjustments [19]. These practices empower businesses to refine project scopes in real time, unlocking the full potential of financial tracking.
Tracking project profitability in real-time has reshaped how professional services firms manage their operations. Instead of facing surprises at the end of a project, real-time insights allow firms to identify risks early and make adjustments to protect their margins. As Ryan Kagan from WorkflowMAX puts it:
"Profitability should not be something you only discover at the end of a project, especially when margins are tight, clients have high expectations, and teams are stretched" [1].
Switching from manual to automated tracking can make a big difference. Many firms lose 20–30% of billable hours due to forgotten timers or rounding errors. Automated systems help recover those lost hours and improve overall accuracy [2].
However, technology alone isn’t enough. Success also depends on consistent practices. For example:
Breaking down projects into segments can also help pinpoint where budgets are being stretched thin [1]. These steps create a strong foundation for firms looking to grow and improve profitability.
Phoenix Strategy Group offers tools to help firms take this to the next level. Their solutions, such as the Weekly Accounting System and Monday Morning Metrics, integrate real-time data with financial planning and fractional CFO services. Their Integrated Financial Model ties project performance to long-term business goals, giving firms the tools they need to scale effectively.
Understanding your numbers is essential for making smarter decisions, safeguarding your margins, and running a more profitable business [1]. Real-time tracking gives you the clarity and control to achieve that.
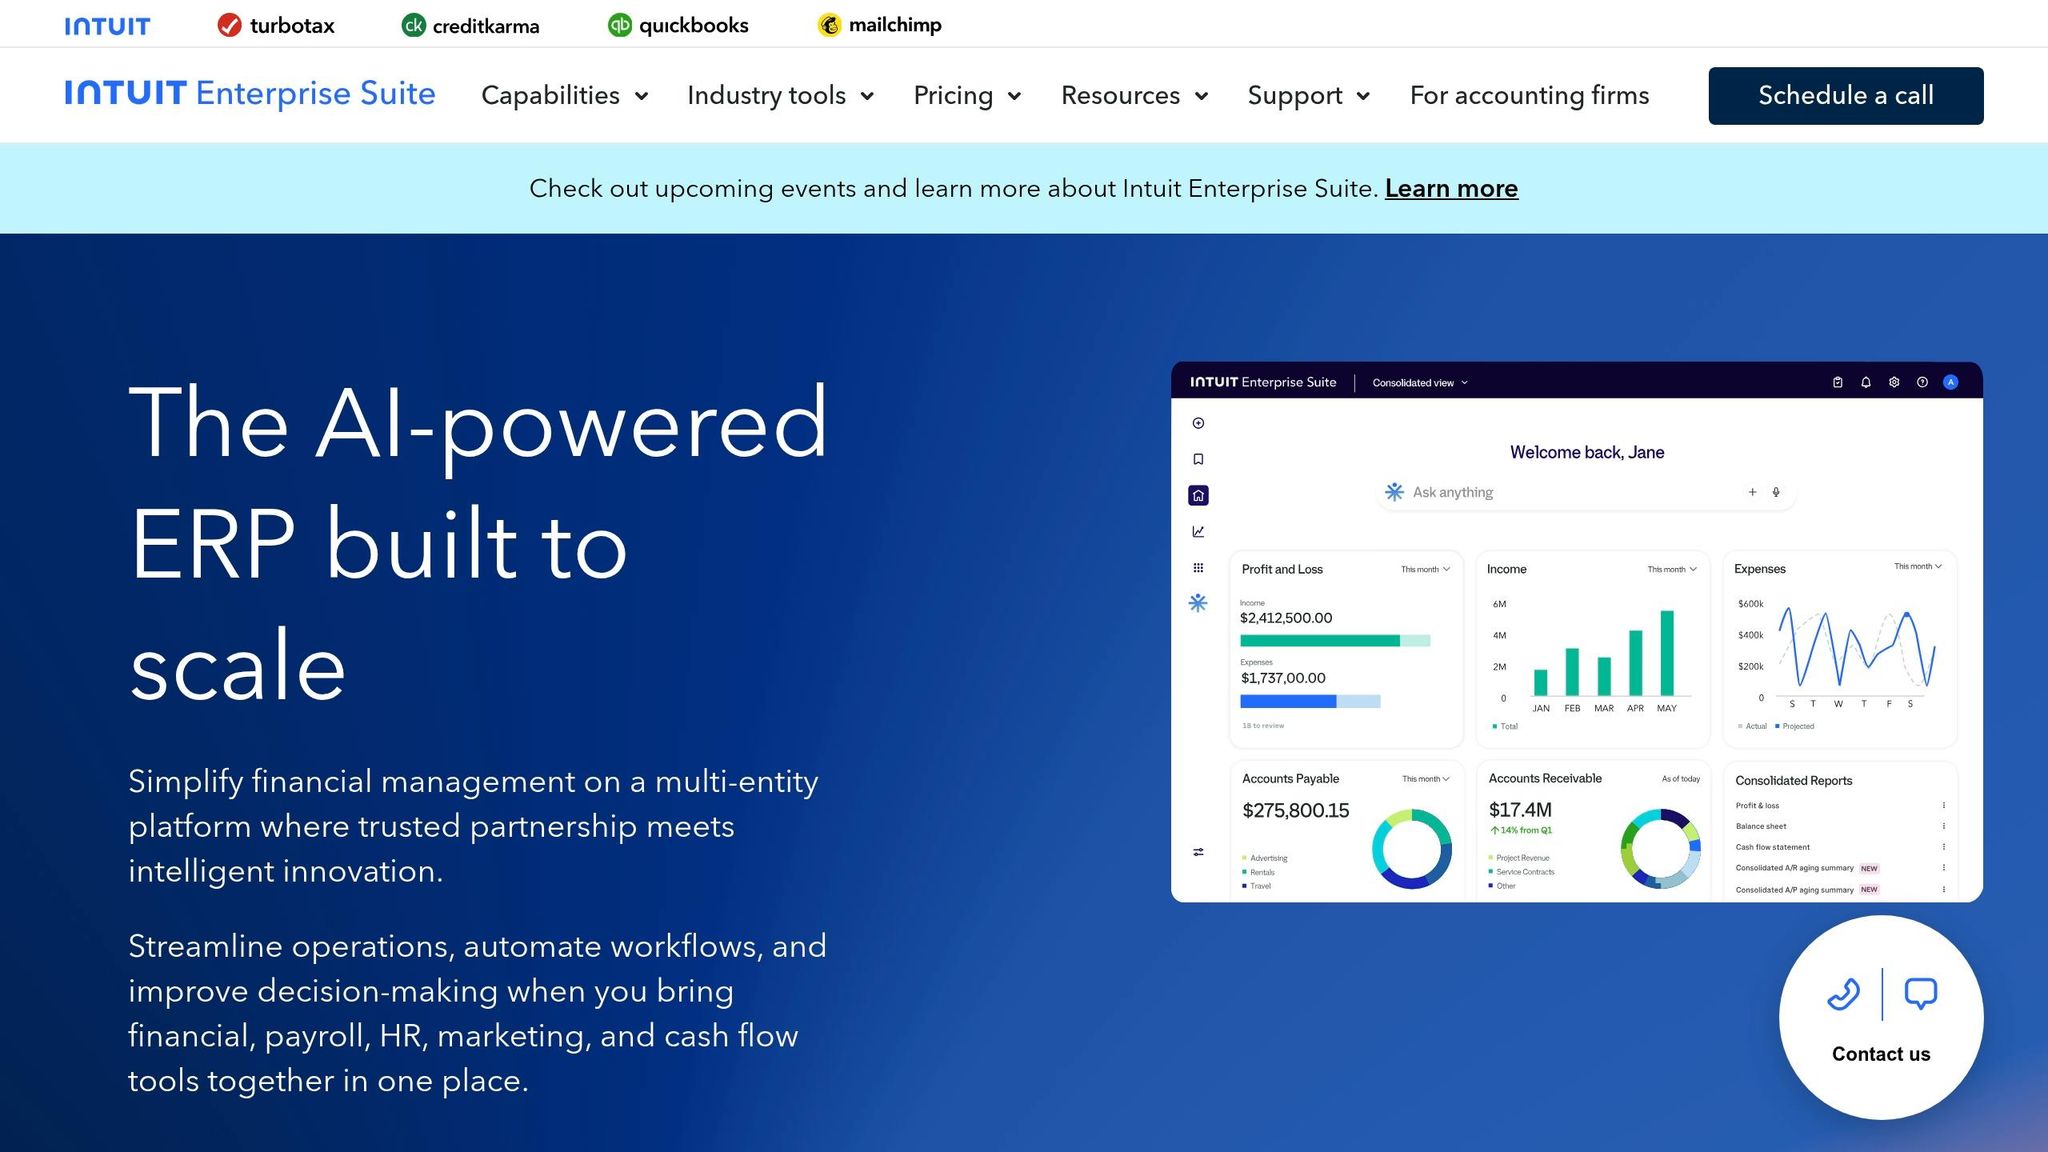
The fastest way to get started with real-time profitability tracking is by using a financial dashboard. This tool connects directly to essential data sources like your accounting software, payment processors, and CRMs, giving you a centralized view of your finances.
By automating data updates, you’ll have instant access to key metrics like revenue, expenses, and cash flow without waiting for manual reports. To make the most of your dashboard, focus on tracking 5–7 key KPIs that align with your goals. This approach helps you gain meaningful insights and avoids the delays often caused by traditional monthly reporting.
Key metrics to track for weekly project profitability are real-time job costing, cash flow, expenses, and performance dashboards. These tools provide a clear view of project margins and overall financial status, helping you spot trends and make adjustments quickly to boost profitability.
To effectively transform real-time alerts into actionable budget or scope adjustments, start by defining clear objectives for your financial dashboards. Prioritize key metrics, such as cash flow and expenses, to ensure you're tracking what matters most. When alerts signal deviations - like unexpected cost increases or scope creep - dig deeper to uncover the underlying cause. Use this insight to make targeted adjustments, whether that means reallocating funds, revising estimates, or updating priorities. Relying on accurate, up-to-the-minute data allows for smarter, more proactive decisions.