Published on
December 29, 2025


Revenue forecasting can be tough, especially when your data is inconsistent or messy. That’s where the Prophet model, developed by Meta, steps in. Designed to handle irregular patterns, nonlinear trends, and seasonal effects, Prophet simplifies forecasting for businesses navigating complex revenue data.
Here’s what you’ll learn:
Prophet is particularly effective for growth-stage companies dealing with abrupt trend changes or high variability. By following these steps, you can create forecasts that align with your business goals and adapt to changing conditions.
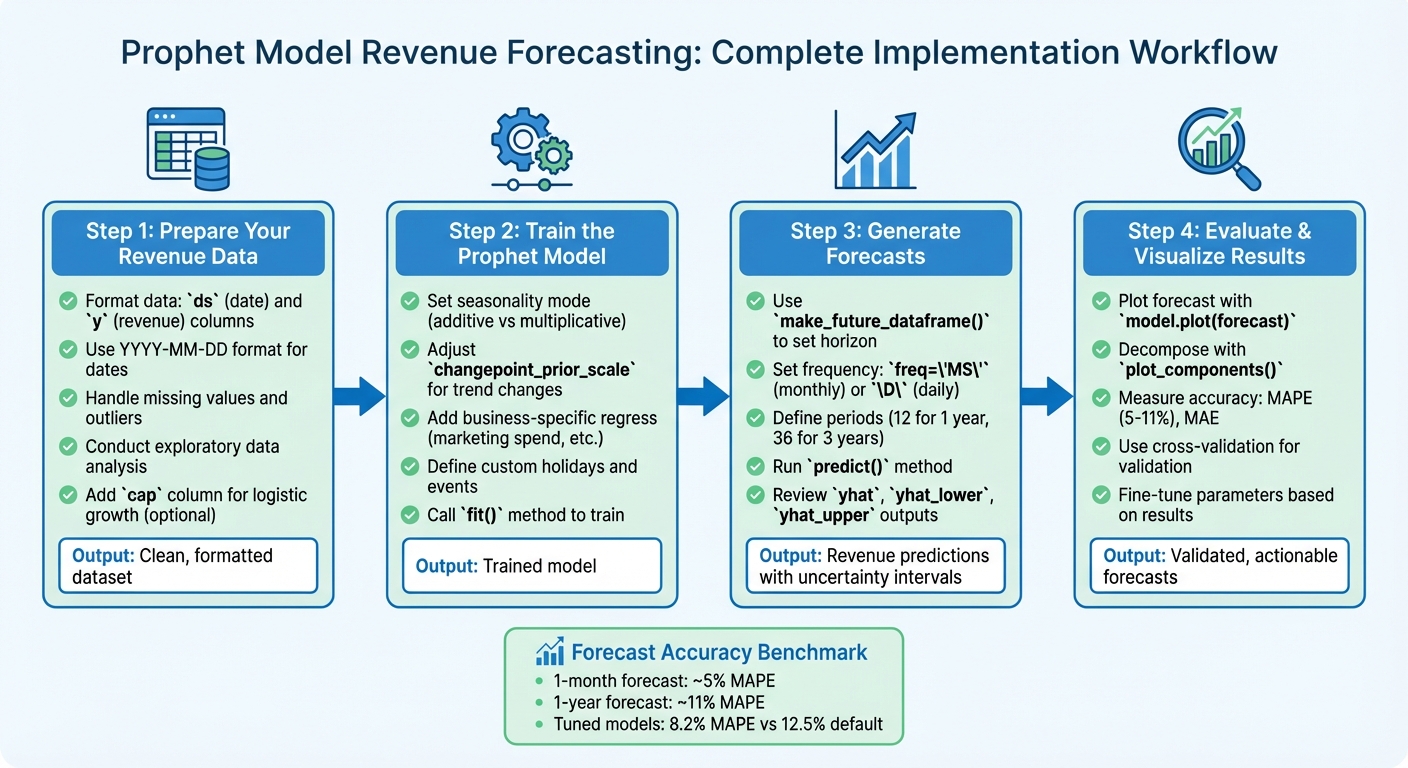
Prophet Model Revenue Forecasting Workflow: 4-Step Implementation Guide
Before diving into forecasting with Prophet, it's essential to ensure your revenue data is properly formatted. While Prophet can handle some imperfections, setting up your data correctly from the beginning will save you a lot of trouble later on.
Prophet works with a straightforward two-column format. The first column, named ds (short for datestamp), should contain your dates in a format that Pandas recognizes - ideally YYYY-MM-DD for daily data or YYYY-MM-DD HH:MM:SS for hourly data [1][4]. The second column, y, holds your numeric revenue values [1].
If your model involves logistic growth (more on that later), you'll also need a third column, cap, which specifies the maximum revenue capacity [8]. However, for most revenue forecasting tasks, the two basic columns will suffice.
For example, if your spreadsheet includes columns like "Date" and "Total Revenue", simply rename them to ds and y. Also, ensure any dates in MM/DD/YYYY format are converted to YYYY-MM-DD for compatibility.
| Column Name | Data Type | Description | Required Format |
|---|---|---|---|
ds |
Datetime/String | The time index for the revenue data | YYYY-MM-DD or YYYY-MM-DD HH:MM:SS [1] |
y |
Numeric | The revenue value to be forecasted | Float or Integer [1] |
cap |
Numeric | Maximum carrying capacity (logistic growth only) | Float or Integer [8] |
Once your data is formatted, the next step is to address any gaps or irregularities.
Prophet is designed to handle missing data and outliers [2], but consistent gaps in your dataset can affect seasonality detection. For instance, if your revenue data only includes weekdays or specific business hours, you'll need to adjust your forecasting approach [4].
"The solution is to only make predictions for the time windows for which there are historical data." - Prophet Documentation [4]
To avoid unrealistic fluctuations, align your forecast horizon with your historical data patterns. For example, if your dataset only includes weekday sales, limit predictions to weekdays. Similarly, for monthly data, use the freq='MS' parameter (month-start) when generating forecasts to prevent Prophet from interpolating unnecessary daily values [4].
After cleaning and formatting your data, it's time to conduct exploratory analysis to uncover trends and seasonal patterns. Prophet performs best with datasets that show clear seasonal effects and include several seasons of historical data [2]. Start by plotting your revenue over time to identify whether it follows a linear or curvilinear trend.
Look for recurring seasonal behaviors, such as spikes in December or dips during the summer. Aggregating your data by day of the week or month can help reveal these patterns. For example, a data scientist working with a Kaggle retail dataset analyzed five years of sales data across multiple stores. By plotting annual sales, he discovered a clear upward trend and weekly seasonality. This analysis guided his decision to use linear growth and multiplicative seasonality in Prophet, which he scaled to thousands of models using PySpark [9].
Pay close attention to outliers and sudden shifts. While Prophet can manage these anomalies, understanding their causes - like a holiday sale or major promotion - can help you decide whether to model them explicitly [2][9].
If your data shows high variance or exponential growth, applying a logarithmic transformation to your revenue values can stabilize the series, making patterns more apparent and improving forecast accuracy [1].
Finally, double-check for missing values, duplicate entries, and ensure your y column is numeric while your ds column contains valid dates [1][9]. These steps will set you up for a smoother forecasting process.
To get started, create a Prophet object in Python. Choosing the right seasonality mode is key here. Many businesses experience seasonal trends that grow as the company scales - think holiday sales that increase year-over-year. In such cases, switch to seasonality_mode='multiplicative' rather than sticking with the default additive mode [10].
For companies with high revenue figures - like those generating millions annually - the default scaling may compress your data too much, leading to fitting issues. To fix this, you can add scaling='minmax' when setting up the model [10]. Additionally, tweak the changepoint_prior_scale parameter to better capture rapid revenue changes, such as those triggered by a major product launch or a funding round [6].
Finally, customize the model to reflect your business's unique dynamics.
Prophet allows you to integrate domain-specific insights into your forecasts. Use the add_regressor() function to include external drivers of revenue, like marketing spend, funding rounds, or product launches [10]. This works especially well if you can predict future values for these factors. For instance, if you know your planned ad spend, adding it as a regressor can significantly refine your forecasts.
You can also define custom holidays to account for recurring business events. For example, if you run an e-commerce company, create a dataframe with dates for Black Friday, Cyber Monday, or annual sales promotions, and feed it into the model. This prevents Prophet from misinterpreting predictable revenue spikes as permanent trend shifts [1][6]. If your business is approaching market saturation, consider switching to logistic growth by setting growth='logistic' and adding a cap column to your dataframe to represent the revenue ceiling [6].
Once your dataframe is ready, call the fit() method to train the model. Thanks to Stan, this process is typically very quick [1][2].
"The Prophet procedure includes many possibilities for users to tweak and adjust forecasts. You can use human-interpretable parameters to improve your forecast by adding your domain knowledge." - Meta Open Source [2]
If you need to update forecasts frequently, such as when new revenue data arrives daily, use the init parameter to warm-start the model with previous parameters. This can make fitting up to five times faster [10]. After fitting, use the plot_components() function to confirm that the model's trends and seasonality align with your business cycles [1].
At Phoenix Strategy Group, we apply these techniques to create accurate revenue forecasts that support strategic planning.
Once the model is fitted, you’re ready to generate forecasts and dive into analyzing the results.
Once your model is fitted and validated, the next step is to generate forecasts and make sense of the results.
To extend your historical data and create future projections, use the make_future_dataframe() function. This allows you to define how far into the future you'd like to forecast. For monthly revenue data, set freq='MS' (month-start in Python), and for daily data, use 'D'. Choosing the wrong frequency can lead to misleading outputs and even overfitting [4].
The periods parameter determines how many future periods to include in your forecast. For instance, setting periods=12 gives a one-year outlook, while periods=36 extends it to three years. Keep in mind that forecast accuracy tends to diminish as the horizon grows [5]. The inclusion of historical dates in your model helps ensure a smooth transition from past trends to future projections [1][11].
"When fitting Prophet to monthly data, only make monthly forecasts, which can be done by passing the frequency into make_future_dataframe." - Prophet Documentation [4]
If your revenue is tied to specific days - like weekdays for many B2B businesses - you should filter the future dataframe to exclude weekends. This is especially important because weekly seasonality won't be accurately captured during periods with no transactions [4].
Running the predict() method generates a dataframe containing several key outputs. The yhat column provides the predicted revenue, factoring in the model's trend, seasonality, and holiday components [1]. The yhat_lower and yhat_upper columns represent uncertainty intervals, typically set to 80% confidence. These intervals give you a range of potential outcomes, with wider bands indicating higher uncertainty - particularly for longer forecast horizons or volatile periods [1][7].
The model also breaks the forecast into individual components for deeper analysis. The trend reflects the underlying direction of your revenue - whether it's growing, plateauing, or declining - without seasonal fluctuations. Yearly seasonality captures recurring annual patterns, such as holiday shopping peaks or year-end fiscal trends, while weekly seasonality highlights variations by day of the week [1][2]. If you’ve added custom holidays, their impact will be shown separately from standard seasonal effects. These insights provide a foundation for refining your forecasts to better match your business’s unique revenue patterns.
After reviewing the forecast results, you may need to tweak the model to improve its accuracy. As new revenue data becomes available, revisit your parameters to keep forecasts up to date. For instance, adjust the changepoint_prior_scale to better capture sudden shifts, such as those caused by a product launch or a significant market event. A higher value makes the model more responsive to changes, while a lower value reduces the risk of overfitting. Similarly, the seasonality_prior_scale can be adjusted to fine-tune how the model handles recurring cycles.
If your revenue has a natural ceiling - perhaps due to market saturation - you can switch to logistic growth by setting growth='logistic' and adding a cap column to your data [8]. You can also modify the interval_width to adjust the confidence range. For example, increasing it from the default 0.80 to 0.95 provides a more conservative outlook. After making any adjustments, use the plot_components() function to ensure that the model is correctly attributing revenue to trend, seasonality, and holidays before finalizing your forecast [1].
Once you've forecasted revenue, it’s critical to assess how well your model performs and visualize the results to extract actionable insights.
To get a clear picture of your forecast, use model.plot(forecast). This function displays historical revenue as black dots, predicted values (yhat) as a solid blue line, and uncertainty intervals as shaded regions [1]. For more detailed insights, you can use model.plot_components(forecast) to break down the forecast into its trend, weekly, and yearly components. This decomposition can reveal patterns, like consistent revenue spikes during certain months (e.g., November and December) or higher weekday sales compared to weekends.
If you need an interactive experience, tools like plot_plotly() and plot_components_plotly() let you zoom in on specific time periods and explore your data dynamically [1].
While visualizations provide a strong intuitive understanding, numerical metrics are essential to confirm the reliability of your forecasts.
To evaluate the accuracy of your predictions, use metrics that quantify forecast errors. One common metric is MAPE (Mean Absolute Percentage Error), which expresses errors as a percentage of the actual revenue. For example, a MAPE of 8% means your forecast is typically off by around 8% of the actual values [13]. This metric is especially useful when comparing forecasts across different revenue scales.
Another key metric is MAE (Mean Absolute Error), which measures the average dollar amount by which your forecast deviates from actual revenue. This can help you understand the financial impact of your forecasting errors [13].
Prophet simplifies this process with its cross_validation function, which simulates historical forecasts, and performance_metrics, which computes critical statistics. According to the Prophet documentation, forecast errors typically range from about 5% for one-month forecasts to 11% for one-year forecasts [12].
"Prophet includes functionality for time series cross validation to measure forecast error using historical data... by selecting cutoff points in the history, and for each of them fitting the model using data only up to that cutoff point." - Prophet Documentation [12]
Here’s a sample comparison of accuracy between default and tuned models:
| Parameter Set | MAPE | MAE | Use Case |
|---|---|---|---|
| Default | 12.5% | $5,000 | General trend analysis |
| Tuned (Custom) | 8.2% | $3,200 | Detailed growth planning |
When selecting metrics, think about your specific needs. Use MAPE for comparing accuracy across different revenue scales, as it’s not affected by global scaling. For datasets with outliers, consider MAE or MedAE (Median Absolute Error) for more robust measurements. Additionally, the coverage metric - showing how often actual revenue falls within the predicted uncertainty intervals - can help you evaluate the reliability of your confidence intervals [12] [13].
This guide has walked you through the essentials: data preparation, model training, generating predictions, and evaluating performance. With its ability to handle non-linear trends, multiple seasonal patterns, and holiday effects, Prophet is a powerful tool for tackling complex revenue forecasting challenges [3][14].
To take your forecasting to the next level, consider diving into advanced techniques. For instance, hyperparameter tuning - adjusting settings like changepoint_prior_scale and seasonality_prior_scale - can significantly refine your model’s accuracy [15]. If your business manages multiple revenue streams, hierarchical forecasting might be the way forward. By training separate models for individual products or locations, you can gain more detailed insights compared to using a single aggregate model [15]. These methods demonstrate how blending domain expertise with technical adjustments can lead to sharper, more precise forecasts.
"The Prophet procedure includes many possibilities for users to tweak and adjust forecasts. You can use human-interpretable parameters to improve your forecast by adding your domain knowledge." - Meta Open Source [2]
While Prophet simplifies many aspects of forecasting, achieving accurate revenue predictions still requires specialized expertise. As Matt McDonagh, Head of RevOps, puts it:
"Time series analysis requires a specialized skill set that combines statistical knowledge with domain expertise" [14]
Expert guidance can help bridge the gap between raw forecast data and actionable strategies. By integrating these insights into your financial planning, you can align your forecasts with broader business goals and improve decision-making.
For businesses looking to streamline this process, Phoenix Strategy Group (https://phoenixstrategy.group) offers tailored financial forecasting solutions. Their services combine Prophet with advanced techniques to build comprehensive FP&A workflows. Whether you’re preparing for fundraising, scaling operations, or optimizing cash flow, their fractional CFO services and data engineering expertise can help you turn forecasts into impactful business strategies. Partnering with experts ensures your revenue projections aren’t just numbers - they’re tools for driving meaningful outcomes.
The Prophet model is built to handle missing data effortlessly. Thanks to its additive structure, it can work around gaps in your revenue data without needing you to manually fill in the blanks. Just leave those missing data points as they are, and the model will incorporate them into its forecasting process.
This capability makes Prophet particularly handy in practical situations where datasets are often less than perfect, delivering dependable predictions even when information is incomplete.
To tailor the Prophet model for your business, start by organizing your data into a dataframe with two essential columns: ds for dates (e.g., 2025-12-31) and y for revenue figures (e.g., $1,250,000). Once your data is ready, customize the model by tweaking parameters to match your business needs. For instance, you can modify the growth parameter (e.g., 'linear' or 'flat') and incorporate custom holiday or event data to account for critical dates like promotions or product launches.
If there are other factors influencing your revenue - such as marketing spend or pricing adjustments - you can include these as additional regressors in the model before fitting it to your data. After configuring the model, fit it and create a future dataframe to generate forecasts. This method allows your predictions to reflect the unique elements driving your business, resulting in more precise and useful insights.
To improve the precision of your revenue forecasts using Prophet, start by preparing a clean dataset. Your dataset should include two key columns: ds, which contains dates formatted as YYYY-MM-DD, and y, which represents revenue in US dollars (e.g., $1,250,000). Double-check for errors, address small data gaps, and, if your revenue data has sharp spikes or grows exponentially, consider applying a log transformation to stabilize the variance.
For more accurate predictions, factor in external influences such as holidays, product launches, or marketing expenditures by incorporating regressors. You can fine-tune parameters like changepoint_prior_scale to adjust trend flexibility and enable seasonality settings - for example, yearly, weekly, or custom monthly patterns - to capture recurring revenue fluctuations. To ensure your model performs well, test various configurations and evaluate metrics like MAE (Mean Absolute Error) or RMSE (Root Mean Square Error) to identify the best setup.
Pro Tip: Need expert help? Phoenix Strategy Group can guide you through data cleaning, selecting regressors, and optimizing your Prophet model for reliable and actionable forecasts.