Published on
December 29, 2025


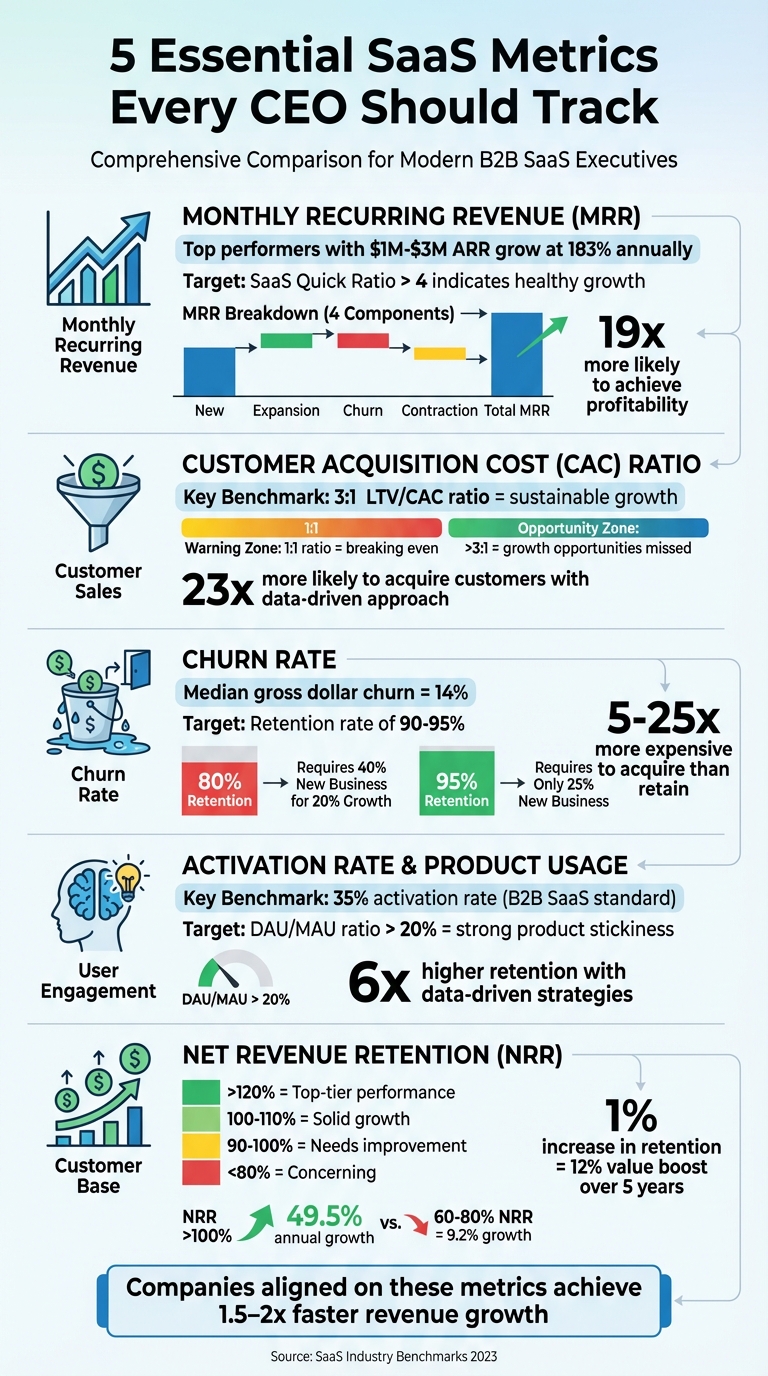
Running a SaaS business without a dashboard is like flying blind. A well-designed dashboard helps CEOs track key metrics, align teams, and make decisions faster. The top five metrics every SaaS CEO should focus on are:
5 Essential SaaS Metrics Every CEO Should Track on Their Dashboard
MRR serves as a critical indicator of trends over time, offering valuable insights for decision-making. For instance, Baremetrics noticed a slowdown in their MRR growth during February and March 2020. By using their real-time dashboard, they quickly identified the issue and redirected development and marketing efforts toward upsells and launching a new product line. This proactive approach helped reverse the trend. Keeping an eye on MRR provides early warning signs, enabling businesses to tackle problems before they escalate.
"For SaaS companies, the difference between success and failure is often about catching concerning trends early. Our financial dashboard alerted us to a subtle increase in enterprise customer churn three months before it would have shown up in quarterly reports, allowing us to intervene before losing significant revenue." - Sarah Chen, CFO, CloudStack Solutions [1]
Breaking MRR into four components - New MRR (from new customers), Expansion MRR (upsells and upgrades), Churn MRR (cancellations), and Contraction MRR (downgrades) - helps businesses pinpoint the exact sources of growth or decline. Companies that leverage these metrics are statistically 19 times more likely to achieve profitability [3].
These insights provide a strong foundation for refining growth strategies.
Accurate MRR data plays a key role in securing funding. SaaS companies that rely on standardized financial reporting and advanced dashboards are 35% more likely to obtain follow-on funding compared to those using basic spreadsheets [1]. Segmenting MRR by customer type or acquisition channel can highlight the most scalable opportunities, allowing for smarter resource allocation.
Tracking metrics like the SaaS Quick Ratio - calculated as (New + Expansion MRR) ÷ (Churned + Contraction MRR) - offers another layer of insight. A ratio above 4 indicates healthy growth, while a ratio below 1 suggests contraction [2]. These tools help businesses measure and maintain revenue health effectively.
MRR growth expectations can vary significantly depending on company size. ChartMogul’s benchmarks reveal that top-performing companies with $1–$8M ARR grow at an annual rate of 70%, while those in the $8–$30M ARR range grow at approximately 45% [5]. For companies in the $1–$3M ARR segment, the top 10% achieve an impressive 183% annual growth rate [5].
| ARR Band | Median Annual Growth | Upper Quartile Growth | Upper Decile Growth |
|---|---|---|---|
| $1M - $3M | 38.9% | 88.1% | 183.3% |
| $3M - $8M | 29.4% | 58.8% | 119.2% |
| $8M - $15M | 24.4% | 47.1% | 84.2% |
| $15M - $30M | 23.1% | 42.9% | 64.3% |
Source: ChartMogul SaaS Benchmarks Report [5]
One emerging trend is the growing importance of expansion revenue. Between 2020 and 2023, the proportion of ARR from expansion increased from 28.8% to 32.3%. Companies with net retention rates above 100% grow at least 1.8 times faster than their competitors [5]. Tracking expansion MRR separately allows businesses to maximize revenue from existing customers.
These benchmarks not only validate your performance but also guide strategic decisions.
To stay ahead, CEOs should monitor MRR weekly and review finances monthly [4]. Breaking down MRR by factors like plan level, geography, or acquisition channel can uncover high-value segments. Automating dashboard reporting can save analysts up to 20 hours per week, freeing up time for deeper strategic analysis [3].
Balancing MRR growth with profitability is equally important. The Rule of 40 - where the sum of your growth rate and profit margin exceeds 40% - is a useful framework for ensuring long-term sustainability [2]. Companies that align their strategies around key metrics like MRR consistently outperform their peers in revenue growth [1].
The LTV/CAC ratio is a key metric for understanding how efficiently you're acquiring customers. It compares the revenue a customer generates over their lifetime to the cost of acquiring them, helping you gauge whether your growth strategy is on solid ground. A good rule of thumb is to aim for a 3:1 LTV/CAC ratio - this suggests sustainable growth. On the other hand, a 1:1 ratio indicates that acquisition costs are too high to support long-term profitability[6].
Breaking down CAC by pricing tiers can also uncover inefficiencies. For instance, if acquiring customers in one pricing tier costs more than their lifetime value, it’s a clear sign that resources need to be reallocated[6].
"What gets measured gets managed." - Peter Drucker, Management Theorist[3]
These insights provide a foundation for comparing your metrics against industry standards.
Benchmarking your LTV/CAC ratio against industry norms helps fine-tune your strategy. Here’s a quick guide to common benchmarks for SaaS companies:
| LTV to CAC Ratio | Business Implication | Strategic Action for CEO |
|---|---|---|
| Less than 1:1 | Financial strain | Cut acquisition costs or rethink your strategy |
| 1:1 | Breaking even (or worse) | Reassess your unit economics and cost structure |
| 3:1 | Healthy and sustainable | Focus on scaling while maintaining efficiency |
| Higher than 3:1 | Growth opportunities missed | Increase marketing and sales efforts to capture more market share |
Source: Customer Acquisition Cost Analysis[7]
If your ratio exceeds 3:1, it might mean you’re not investing enough in growth. Boosting your acquisition spend could help you grab more market share without sacrificing profitability[7].
Keeping an eye on your CAC payback period alongside the LTV/CAC ratio is crucial for managing cash flow, especially when resources are tight. This metric shows how quickly you recover the money spent on acquiring a customer - a critical factor when planning budgets and scaling operations[1].
For the most accurate picture, use a comprehensive CAC calculation that includes marketing, sales, software, and overhead expenses[7]. Relying on a simplified method - like dividing marketing spend by the number of new customers - can lead to an incomplete understanding of your costs. Companies that use detailed, data-driven approaches are 23 times more likely to succeed in acquiring customers and 19 times more likely to achieve profitability[3].
Churn rate provides a clear snapshot of customer retention, showing the percentage of users who cancel their subscriptions within a given period. It’s a critical metric for understanding the overall health of your business. By leveraging real-time dashboards, you can identify troubling patterns long before they surface in quarterly reports. This proactive approach allows for timely action while making benchmark comparisons invaluable for setting realistic retention goals.
"For SaaS companies, the difference between success and failure is often about catching concerning trends early. Our financial dashboard alerted us to a subtle increase in enterprise customer churn three months before it would have shown up in quarterly reports, allowing us to intervene before losing significant revenue." - Sarah Chen, CFO, CloudStack Solutions [1]
High churn doesn’t just cut into revenue - it also signals risk to investors, potentially lowering your company’s valuation [6]. On the other hand, strong customer retention ensures you get the most out of every marketing dollar spent [6]. Research shows that data-driven strategies can increase customer retention sixfold [3], underscoring the importance of monitoring this metric in real time.
In the SaaS world, the median gross dollar churn rate is 14% [8]. However, aiming for retention rates of at least 90% - and ideally exceeding 95% - is key to maintaining a healthy business [6]. These benchmarks are not just numbers; they directly influence your ability to grow efficiently and sustainably.
| Metric | Target Benchmark | Strategic Significance |
|---|---|---|
| Median Gross Dollar Churn | 14% | Baseline for SaaS industry health |
| Target Retention Rate | 90-95% | Drives higher valuations and reduces pressure on customer acquisition |
| Net Revenue Retention (NRR) | >125% (Great) | Reflects strong growth potential and customer satisfaction |
Here’s why retention matters: if your retention rate is 80%, achieving 20% growth requires adding 40% new business. But with a 95% retention rate, that same growth goal only demands 25% new business [6]. The efficiency gains are enormous, especially when working with limited resources.
It’s important to differentiate between customer churn and revenue churn. Losing a large number of low-value customers might hurt less than losing a single high-value enterprise client [8]. Segmenting churn by pricing tiers or product lines can help pinpoint which areas are costing you more than they’re bringing in [6].
Watch for early warning signs like reduced communication, negative feedback, multiple refunds, or declining engagement metrics [8]. Automating alerts for triggers - such as inactive users or upcoming credit card expirations - can help mitigate involuntary churn [6]. Keep in mind that 73% of consumers will switch to a competitor after multiple poor experiences [8]. Since acquiring a new customer is 5 to 25 times more expensive than retaining an existing one [9], focusing on retention is not just smart - it’s essential for maximizing capital efficiency.
After analyzing customer retention, measuring activation provides an early glimpse into how users might engage with your product over time. The activation rate tracks the percentage of new signups who reach an "aha moment" - that critical point where they understand your product's value and take meaningful action. This metric acts as an early signal for long-term retention and conversion trends [11]. Unlike revenue metrics, which reflect past performance, activation data offers a forward-looking view of user behavior.
The DAU/MAU ratio (Daily Active Users divided by Monthly Active Users) is another key metric that measures product stickiness. A declining ratio can highlight potential problems well before churn becomes evident in financial reports. By leveraging effective data visualization and making data-driven decisions, organizations can increase decision-making speed by 25% and achieve up to six times higher retention rates [3]. These insights allow CEOs to determine whether challenges stem from attracting new users or keeping existing ones engaged [6].
Using benchmarks for activation metrics helps refine your understanding of product engagement. For B2B SaaS companies, an activation rate of 35% is a common standard [11]. Similarly, a DAU/MAU ratio of 20% or higher is typically a sign of strong product stickiness [6]. Falling short of these benchmarks often points to issues like onboarding friction or a mismatch between user expectations and the actual experience.
| Metric | Benchmark | What It Indicates |
|---|---|---|
| Activation Rate | 35% | Percentage of users reaching their first value milestone |
| DAU/MAU Ratio | 20%+ | Measures product stickiness and product-market fit |
| Feature Adoption | Varies by tier | Identifies which features drive upgrades and growth |
To gauge activation success, focus on identifying 1–5 key user actions within the first 2–3 days after signup that indicate users understand your product's value [11]. Validate these actions against historical conversion data to ensure they align with behaviors that predict paying customers [11]. If automated engagement strategies, like triggered emails, don’t improve these metrics, consider reaching out directly to customers to uncover and resolve friction points [6].
Tracking feature adoption by pricing tier is another valuable tactic. This data can reveal which features drive upgrades and inform research and development priorities. It also helps avoid the "shelfware" problem, where 46% of SaaS spending goes to underutilized software [12]. Additionally, segmenting usage data alongside support costs can highlight whether certain customer segments require more resources than the value they generate [6].
High-performing SaaS companies that align their leadership around these metrics are 1.5 to 2 times more likely to achieve above-average revenue growth [1]. By combining activation insights with revenue and retention metrics, CEOs can build a comprehensive dashboard to support sustainable growth.
Net Revenue Retention (NRR) measures how customer spending changes over time, factoring in upgrades, downgrades, and cancellations. Unlike metrics that focus on past performance, NRR gives you a proactive view of revenue trends, often months ahead of traditional reporting. Sarah Chen, CFO at CloudStack Solutions, emphasizes that real-time dashboards can uncover subtle churn patterns before they show up in quarterly reports [1].
This metric works hand-in-hand with others like Monthly Recurring Revenue (MRR) and churn rates, offering a deeper understanding of revenue dynamics. A shared NRR dashboard can align your CFO, CRO, and CMO by highlighting opportunities for growth, retention, and acquisition. Plus, well-designed data visualizations can speed up decision-making by 25% [3]. NRR also helps identify if your growth strategy is overly reliant on acquiring new customers - a risky approach as your business scales [14].
Your NRR target will vary depending on your customer base and pricing structure. For example, B2B SaaS companies serving enterprise clients (with an ARPA over $1,000/month) should aim for NRR between 110% and 125% [5]. Mid-market businesses often land in the 100% to 110% range, while B2C companies with lower-priced offerings typically see NRR below 70% [5]. The difference in growth is striking: companies with NRR above 100% grow at an annual rate of 49.5%, compared to just 9.2% for those with NRR between 60% and 80% [5].
| NRR Level | Business Health | Growth Impact |
|---|---|---|
| > 120% | Top-tier performance | Rapid, efficient scaling [14] |
| 100%–110% | Solid growth | Expanding within the base [13][14] |
| 90%–100% | Stable but slow | Needs improvement [13][14] |
| < 80% | Concerning | Unsustainable trajectory [14] |
To get the full picture, track NRR alongside Gross Revenue Retention (GRR). A high NRR can sometimes mask deeper issues, like heavy reliance on upselling to offset churn. If GRR is declining while NRR remains strong, it’s a red flag that customer losses may be eroding your base [13].
Here’s a compelling stat: a 1% increase in revenue retention can boost your company’s value by 12% over five years [13]. This underscores the critical link between retention and long-term valuation.
Segment your customers by their value to your business, and focus your efforts on high-value accounts with growth potential [13]. Use real-time health metrics - like license utilization and feature adoption - to identify the perfect time for upsell opportunities [13]. Incentivizing Customer Success teams with performance-based pay can also drive results. For instance, 57% of teams using specialized Customer Success platforms report NRR above 100%, compared to 46% of teams without such tools [13].
Lastly, strong financial reporting is key. Companies with clear NRR visibility are 35% more likely to secure follow-on funding [1]. This makes NRR not just a performance metric but a vital tool for both operational and fundraising decisions.
This section takes a closer look at the strengths and drawbacks of key metrics, highlighting how they complement one another and where they fall short.
No single metric can provide all the answers. MRR (Monthly Recurring Revenue) stands out for its predictability and its role as a unifying metric for executive teams. It’s often referred to as a "single source of truth", helping align priorities across the board. Plus, its standardized format makes it ideal for investor communications, boosting follow-on funding by 35% [1][10]. However, MRR is a lagging indicator - it tells you what has already happened, not what’s ahead. It also doesn’t factor in costs, burn rate, or cash flow timing. To truly understand profitability, MRR must be paired with efficiency metrics like CAC (Customer Acquisition Cost) and LTV (Lifetime Value) [6].
Churn rate, on the other hand, is a clear signal of customer dissatisfaction [15]. It’s invaluable for identifying when something has gone wrong, but it’s inherently reactive - by the time churn is measured, revenue has already been lost. NRR (Net Revenue Retention) provides a broader perspective, combining churn with expansion revenue from upsells [10][15]. For example, even a seemingly small 1% change in NRR can influence a company’s valuation by 0.4x to 0.6x revenue [15]. That said, NRR isn’t perfect. It can obscure issues if a few large accounts grow while smaller customers quietly churn, creating a false sense of stability [15]. Pairing NRR with forward-looking metrics like activation rates can help bring these hidden problems to light.
Activation rate and product usage metrics act as leading indicators, helping predict future churn [3]. As Josh Pigford, Founder and CEO of Baremetrics, points out:
"It's common to see startups skewing numbers to demonstrate growth that isn't that real. For example, a chart may show 500,000 new users, but really 450,000 of those users never came back" [16].
The challenge lies in defining the "activation milestone" - it’s subjective and can vary significantly, impacting its reliability and comparability across companies [16].
To make these metrics actionable, organizations must design dashboards that prioritize the right data. Research shows companies that make data-driven decisions are 23 times more likely to acquire customers and 6 times more likely to retain them [3]. Moreover, organizations aligned on key metrics outperform their peers in revenue growth by 1.5x to 2x [1]. A well-structured dashboard often dedicates 10% of its focus to strategic KPIs for executives, 80% to operational metrics for department leaders, and 10% to drill-down metrics for troubleshooting [3].
| Metric | Primary Strength | Primary Limitation | Best Use Case |
|---|---|---|---|
| MRR | High predictability; aligns priorities | Lagging indicator; ignores expenses | Monthly cash flow tracking and board reporting |
| CAC Ratio | Measures acquisition efficiency | Doesn’t reflect long-term customer value | Optimizing marketing spend and sales channels |
| Churn Rate | Highlights customer dissatisfaction | Reactive; identifies issues after they occur | Assessing long-term business sustainability |
| Activation Rate | Predicts future retention | Heavily depends on milestone definition | Forecasting churn and tracking product adoption |
| NRR | Captures growth from existing customers | Can mask poor new customer acquisition | Evaluating upselling and expansion performance |
Net Revenue Retention (NRR) stands out as a key indicator of growth, while maintaining a healthy LTV/CAC ratio (3:1 or higher) signals scalability. On the other hand, a DAU/MAU ratio below 20% can be a red flag for potential churn [6]. These metrics do more than measure performance - they shape how you design dashboards to enable timely, impactful decisions.
Creating an effective dashboard requires careful focus. The 10/80/10 rule is a helpful framework: dedicate 10% to strategic metrics, 80% to operational metrics, and 10% to drill-down details. Organize your dashboard around core areas like acquisition (CAC), retention (NRR, churn), growth (MRR), and financial health. This structure prevents information overload while keeping the most critical insights front and center [1][3].
Set review schedules that align with the urgency of each metric. For example: monitor cash position and sales pipeline daily, track MRR changes and conversion rates weekly, conduct efficiency reviews monthly, and dive into strategic assessments quarterly [1]. This cadence allows you to stay proactive, catching trends early without drowning in unnecessary analysis.
To support these efforts, ensure your technical setup delivers accurate, fast data. Companies that align on key metrics consistently outperform competitors, achieving 1.5× to 2× faster revenue growth. In fact, 78% of top-performing SaaS companies rely on dedicated financial dashboards to make quicker decisions [1]. Direct integrations with tools like Stripe, CRM platforms, and accounting systems are essential to avoid the 29% reporting error rate that can arise from manual data handling [1][10].
Every metric on your dashboard should serve a clear purpose: What decision will change if this number shifts? Metrics that don't lead to action should be removed. As noted earlier, spotting churn trends early is critical. Your dashboard should empower decisive, informed decisions - not just serve as a static report.
A SaaS dashboard gives CEOs access to real-time insights on key business metrics like revenue, churn rates, and customer health. This instant access to data helps leaders make quicker, better-informed decisions, allowing them to adapt to changes with ease and precision.
By gathering all critical information in one place, these dashboards streamline processes and minimize the chance of financial mistakes. They also provide a clear picture of performance trends, equipping CEOs to spot growth opportunities and tackle challenges head-on.
To get a better handle on your CAC ratio, start by cutting back on spending in acquisition channels that aren't delivering results. Shift your attention to improving conversion rates, simplifying the sales process, and zeroing in on customer segments that bring the most value. On top of that, work on boosting customer lifetime value (LTV) by refining retention strategies, introducing upsell options, and cross-selling products or services that complement what you already offer. Strive for an LTV:CAC ratio of 3:1 or higher to keep your growth on solid ground.
Net Revenue Retention (NRR) is one of the most important metrics for SaaS companies. Why? Because it measures how much revenue comes from your existing customers over time, factoring in retention, upselling, and cross-selling. A high NRR signals happy customers, effective upselling strategies, and steady growth - all essential for long-term success.
NRR also plays a big role in determining a company’s valuation. Even a slight uptick in NRR can have a noticeable impact on long-term value. Plus, a strong NRR shows that your business can grow without solely depending on acquiring new customers, making it a vital metric for CEOs to track and improve.