Published on
December 21, 2025


Segment profitability analysis helps SaaS companies identify which customer groups generate profits and which drain resources. By breaking down financial performance into segments - like customer types, subscription tiers, or acquisition methods - you can make smarter decisions about pricing, resource allocation, and growth strategies. Key metrics like Gross Margin, Customer Acquisition Cost (CAC), Lifetime Value (LTV), and Contribution Margin provide a clear picture of which segments are worth investing in and which ones need optimization.
This approach helps SaaS companies improve profits, optimize growth efforts, and focus on the customers that matter most.
To better understand your customer base and maximize profitability, start by dividing your customers into meaningful segments. Most SaaS businesses rely on four primary segmentation approaches: demographic, behavioral, financial, and engagement-based segmentation [5].
Each method uncovers unique insights into cost structures and revenue patterns, which are crucial for making smarter financial decisions. For instance, enterprise customers might generate $10,000 in ARPU with a churn rate of just 3%, while small businesses might contribute $500 in ARPU but have a higher churn rate of 8% [5]. However, high revenue doesn't always equal high profitability. Segments with large transaction values may come with higher fulfillment or customer service costs, resulting in slimmer profit margins compared to lower-revenue, low-maintenance groups [1].
Your segmentation framework should align with your profitability goals and the data available to you. The right choice depends on what you’re trying to optimize.
If your focus is on improving retention and driving upsells, prioritize segments with high ARPU, low churn, and strong customer satisfaction scores [5]. For product development, behavioral segmentation can reveal which features resonate most with specific customer groups [5]. If cutting costs is your goal, identify resource-intensive segments - such as those with high support ticket volumes or frequent refund requests - and assess whether adjustments to pricing or support models are needed [5][1].
"Segment profitability analysis elevates a business owner's understanding of his/her business by analyzing contribution (or lack thereof) of component parts of the business, and they can provide an invaluable perspective into the strengths and weaknesses of your company." – Sabre Financial Group [1]
A well-structured framework should account for both direct costs (like sales commissions) and indirect costs (such as customer service, marketing, and administration). Pinpointing segments that demand higher resource investments can uncover hidden costs that significantly impact your overall profitability.
SaaS Segment Profitability Metrics: Formulas and Benchmarks
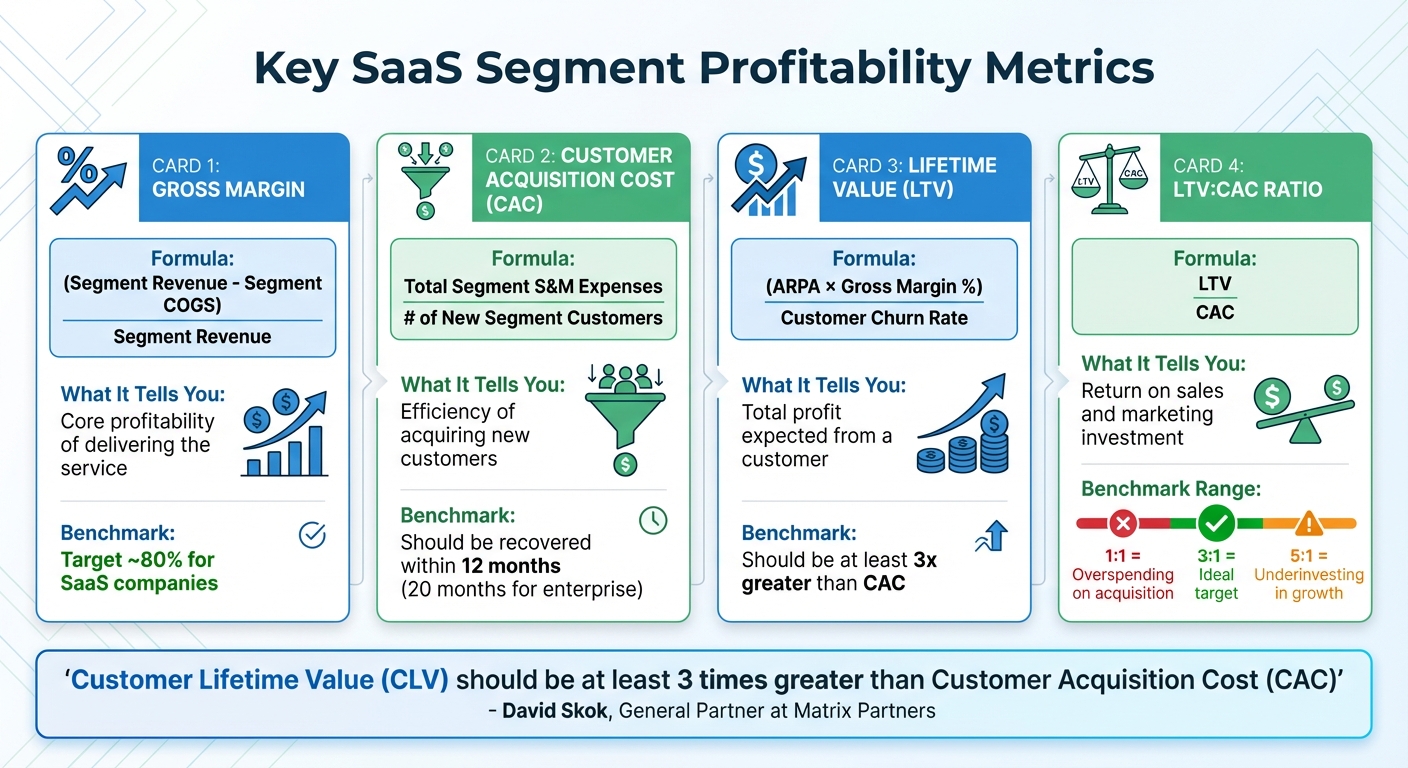
Gross margin measures the profit left after subtracting a segment's direct costs. In the SaaS world, this means taking the segment's revenue, subtracting its specific cost of goods sold (COGS), and dividing the result by the revenue to get a percentage [8]. COGS typically includes expenses like technical support, customer success, and DevOps costs directly tied to serving that segment.
To make this calculation meaningful, it's crucial to use a Chart of Accounts that separates subscriptions, usage fees, and services into distinct ledger accounts [8]. Mixing fixed subscription revenue with variable usage revenue in a single account can muddy the waters, making it nearly impossible to conduct a proper margin analysis. Many SaaS companies aim for gross margins around 80% [8].
"I'm surprised at how often I see a SaaS product architected in a way that means they'll never clear a decent gross margin. Including GM in the calc is a great way for you to see there is a big lever on LTV/CAC that is worth focusing on." – Ron Gill, Former CFO, NetSuite [9]
Once you've analyzed gross margins, the next step is to evaluate how acquisition costs and customer lifetime value impact profitability.
After understanding margins, dive into customer acquisition and value metrics to round out your profitability analysis.
CAC reveals how much you spend on sales and marketing to bring in one new customer within a specific segment. You calculate it by dividing the total segment sales and marketing expenses by the number of new customers acquired in that segment during the same timeframe [9].
LTV, on the other hand, estimates the total net profit a customer generates over their relationship with your business. The basic formula is:
(ARPA × Gross Margin %) ÷ Customer Churn Rate [9].
The balance between these two metrics is critical. David Skok, General Partner at Matrix Partners, emphasizes:
"Customer Lifetime Value (CLV) should be at least 3 times greater than Customer Acquisition Cost (CAC)" [7].
A 1:1 ratio signals overspending on customer acquisition, while a 5:1 ratio might indicate you're underinvesting in growth. Most SaaS companies aim to recover CAC within the first 12 months [7]. However, enterprise-focused businesses using a "land-and-expand" model might take closer to 20 months to break even [9].
For businesses with a diverse customer base, segmenting by size, industry, or sector is vital. Blended metrics can obscure underperforming groups [7]. Additionally, always incorporate gross margin into your LTV calculations to uncover any profitability challenges rooted in your product structure [9].
Contribution margin digs deeper than gross margin by considering all variable costs directly tied to serving a specific segment. This includes additional expenses like targeted advertising or specialized customer support [1]. To calculate it, subtract all direct variable costs from the segment's revenue [8].
This metric is especially useful for managing multiple business units, such as professional services versus subscription revenue. By aligning each segment's revenue with its direct costs, you can pinpoint which customer groups contribute the most toward covering fixed overhead expenses [8]. For instance, a segment may show a strong gross margin but a weak contribution margin if it demands excessive resources like customer service or administrative support [6][1].
Understanding these nuances can guide smarter investment decisions. For example, you might prioritize a segment with a 42% contribution margin over one with only 20% [6].
| Metric | Formula | What It Tells You |
|---|---|---|
| Gross Margin | (Segment Revenue - Segment COGS) / Segment Revenue | Core profitability of delivering the service [8] |
| CAC | Total Segment S&M Expenses / # of New Segment Customers | Efficiency of acquiring new customers [9] |
| LTV | (ARPA × Gross Margin %) / Customer Churn Rate | Total profit expected from a customer [9] |
| LTV:CAC Ratio | LTV / CAC | Return on sales and marketing investment [7] |
These metrics set the foundation for refining product strategies and allocating resources, which will be explored in the next section.
Start by creating a Chart of Accounts that separates different revenue streams. As Ben Murray, a SaaS CFO, explains:
"If we comingle major revenue and expense items in single accounts, we cannot create an accurate SaaS P&L nor perform financial analysis correctly." [8]
This means keeping fixed subscription MRR, variable usage-based revenue, and professional services fees in distinct accounts. Each type of revenue comes with its own margin, so mixing them can lead to inaccurate analysis.
Make sure your CRM and billing systems capture key customer details during onboarding. These attributes help track segment membership over time. Segments can be based on product lines (like subscriptions vs. professional services), customer types (enterprise vs. SMB), or even regions. To make tracking easier, set up a dimensional structure in your accounting software. For example, code expenses by both account (e.g., wages) and department (e.g., Technical Support). This structure ensures that revenue data is well-organized and ready for the next step: cost allocation.
Once your revenue data is sorted, the next step is to allocate costs to each segment. Start with direct costs like sales commissions, labor, and specific expenses such as third-party API fees. For employees who split their time across multiple areas, divide their salaries based on how they spend their time (e.g., 70% on acquisitions, 30% on renewals).
Don’t overlook hidden acquisition costs, such as server hosting for free trials or support provided during proof-of-concept phases. For larger one-time expenses, like trade shows, spread the cost over the period they generate leads to get a more accurate picture.
Now that you’ve organized revenue and allocated costs, it’s time to calculate segment margins. Use this formula:
Segment Profitability = Segment Revenue – Segment Costs
To express the margin as a percentage, divide profit by revenue and multiply by 100. Mapping your ledger to a standardized SaaS P&L will help you calculate these margins accurately.
Analyze margins over a three- to six-month period to spot consistent trends. Businesses that regularly review segment performance and adjust their strategies tend to outperform competitors, achieving up to 25% higher revenue growth. [2]
Once you’ve established clear profit margins for each segment, the next step is to use this data to guide smarter decisions in pricing, resource allocation, and cost management.
High revenue doesn’t always mean high profit. Some segments might bring in significant sales but rack up costs that outweigh their returns. The trick is to dig deeper than just revenue numbers to figure out which segments actually help your bottom line.
Take a closer look at segments with high refund rates or hefty support costs. These could signal issues like product quality problems or marketing that sets unrealistic expectations, driving up expenses unnecessarily [1]. For segments with potential but slim margins, try strategies like tiered pricing or bundling features. These approaches can boost the average order value without adding to service costs [13].
"The sooner you break even on a single customer, the sooner you will reach profitability as a company." - Joel York, Founder and Managing Director, Chaotic Flow [10]
To pinpoint break-even times for each segment, use the formula: CAC / (ARR - ACS). This will help you identify which segments generate positive cash flow the fastest [10]. Focus upselling and upgrade efforts on these customers. Interestingly, smaller clients with strong loyalty can sometimes outperform larger accounts that demand custom solutions and extra support [3]. These pricing tweaks can also guide how you allocate sales and customer success resources.
Segment margin analysis is a great tool for reallocating resources where they’ll have the biggest impact. Studies show that 91% of consumers prefer brands that offer personalized experiences, and segmentation data can improve your understanding of customer behavior by 130% [12].
A simple matrix can help: plot your segments by margin and volume. Segments with both high margins and high volume should get top-tier attention - dedicated customer success managers, priority on feature development, and more marketing spend. For segments with high margins but low volume, concentrate sales efforts on acquisition while offering personalized onboarding [11].
Low-margin segments require a different strategy. Transition these customers to self-service channels to cut down on servicing costs. Many companies find that 20% of their customers or products drive 80% of their profits, so identifying and prioritizing this core group is crucial [11].
"Average margins hide the truth. You might have healthy average margins, but some products or customers are highly profitable while others lose money." - Jack Nicholaisen, Founder, Businessinitiative.org [11]
For segments that consistently lose money, you’ll need to either optimize operations, renegotiate terms, or exit those markets altogether.
Start by improving operations. AI-powered tools or self-service portals can help reduce the resource drain caused by high-touch segments [13]. Take a hard look at supplier contracts and service terms to see if there’s room to lower costs [11]. For segments with expensive fulfillment processes, consider adjusting return policies or service agreements to protect your margins [1].
If a segment remains unprofitable even after these changes, it might be time to make a tough decision. Stop marketing to these customer types and redirect that budget toward audiences that resemble your most profitable segments [13]. Joel York offers a cautionary note about unchecked growth:
"If you grow too fast, you can never catch up, and you'll never be profitable…unless you stop growing! Or, you take action to reduce costs." [10]
"Tracking revenue alone can be misleading. A customer bringing in high sales might seem like a top priority, but what if servicing them costs more than they contribute to your bottom line?" - Sumeet Bose, Content Marketing Manager, Saras Analytics [13]
Make it a habit to review segment profitability monthly or quarterly. Markets shift, and a segment that’s unprofitable today might become viable with the right adjustments - or vice versa [11].
Segment profitability analysis sets high-growth SaaS companies apart by identifying which customer groups contribute to profits and which ones drain resources [1]. By leveraging the metrics and strategies discussed earlier, this analysis becomes a key driver for smarter decision-making.
"A segment profitability analysis is important to see if certain customers add to your profits or cost your company money." - Sabre Financial Group [1]
To make the most of this approach, start by identifying your key segments. Track revenue and costs meticulously, and don’t forget to allocate indirect expenses like marketing and customer service demands [1]. The real game-changer is acting on these insights. Companies that regularly review segment performance and adjust their strategies tend to achieve 25% higher revenue growth compared to their competitors [2].
It’s essential to dig deeper than just revenue numbers. For instance, your highest-paying customers might actually be costing you more than they’re worth when you factor in service expenses. On the flip side, smaller, loyal customer segments could turn out to be your most profitable assets. By aligning cost and revenue data, as outlined in the segmentation framework, you can zero in on high-impact segments and make more informed decisions about pricing, resource allocation, and growth strategies [1].
Begin with a straightforward segmentation framework - whether based on customer type, product line, or geography. Focus on tracking key metrics like Customer Acquisition Cost (CAC), Lifetime Value (LTV), churn rate, and contribution margin. Review these metrics monthly for trends and conduct a thorough profitability analysis every quarter [2]. Scaling successfully isn’t just about increasing revenue; it’s about boosting profit margins too [4]. By consistently applying these insights, SaaS companies can achieve sustainable growth while scaling profitably.
To determine the most effective segmentation method, start by clarifying two key points: what insights you’re aiming to gain and the data you currently have available. Here’s a breakdown of common segmentation approaches and when to use each:
Each method has its pros and cons. For instance, demographic data is easy to gather but may not lead to actionable strategies, while behavioral and needs-based segmentation require more robust data but deliver sharper insights.
After selecting a segmentation method, test its practicality by analyzing historical data. Look at metrics like MRR (Monthly Recurring Revenue) growth, churn rates, and the CAC-to-LTV ratio. Use this analysis to model how each segment impacts profitability and growth. The best segmentation strategy will highlight clear opportunities for profit, align with your business goals, and support long-term growth plans.
To improve the profitability of underperforming SaaS segments, start by diving into the historical data for each segment. Pay close attention to metrics like revenue growth, churn rate, CAC-to-LTV ratio, and profit margins - these will help pinpoint what's driving costs and revenue.
Once you’ve identified the key issues, explore strategic changes. This might mean adjusting pricing models, streamlining costs, or improving customer retention efforts. Redesign the segment’s revenue model based on realistic growth expectations and test your adjustments through scenario analyses - such as base-case, conservative, and optimistic scenarios. Keep a close eye on the outcomes and fine-tune your strategies to achieve consistent and lasting profitability.
Understanding Gross Margin and Contribution Margin is key to grasping the full picture of profitability in a SaaS business. Gross Margin reveals how much revenue is left after covering the direct costs of delivering your product. On the other hand, Contribution Margin factors in additional variable costs, such as marketing and sales, to show the actual economic value a segment brings to your business.
By analyzing these two metrics together, you can pinpoint which segments provide the greatest value, prioritize resources wisely, and make smarter decisions to drive growth and improve profitability.