Published on
July 5, 2026


Bad solar comps can distort value fast. If I’m screening a deal, I want a comp set that matches on project stage, market, interconnection, contract setup, tax credit timing, and near-term capex before I trust any $/MW figure.
Here’s the short version: I separate operating assets, late-stage development, and solar-plus-storage first. Then I check a few deal-breakers: MW-AC vs. MW-DC, ISO/RTO, queue and GIA status, PPA tenor, offtaker credit, and any inverter, augmentation, or upgrade costs that would shift net value. I also treat a project with a merchant tail very differently from one with long-term contracted revenue.
A few numbers matter right away:
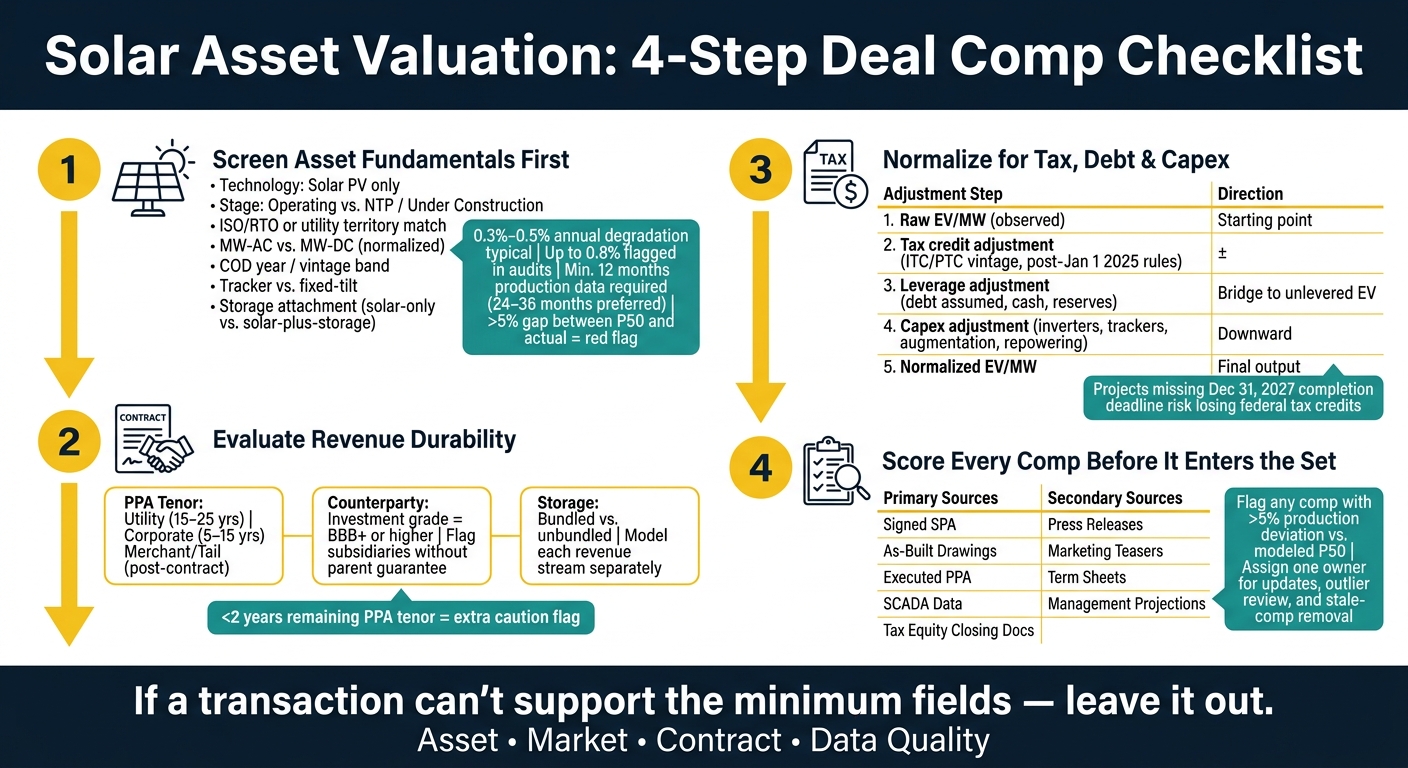
Solar Asset Valuation: 4-Step Deal Comp Checklist
| Area | What I check first | Why it affects price |
|---|---|---|
| Asset basics | Stage, COD year, tech, tracker/fixed tilt, storage | Different risk and output profile |
| Market | ISO/RTO, node vs. hub, congestion | Revenue can vary by location |
| Interconnection | Queue position, study phase, POI, GIA | Upgrade cost and timing risk |
| Contract | PPA tenor, pricing, TOD, curtailment, merchant tail | Cash flow durability changes value |
| Counterparty | Utility vs. corporate, rating, parent guarantee | Payment risk changes discount rate |
| Tax and structure | ITC/PTC regime, flip status, asset vs. equity sale, debt assumed | Headline price may not equal clean EV |
| Near-term capex | Inverters, tracker repairs, augmentation, repowering | Raw EV/MW may overstate value |
| Data quality | Source docs, SCADA, as-built records | Weak source data makes the comp harder to use |
If I can’t verify the core fields, I leave the deal out. That’s the simplest way to keep a solar comp set tight and usable.
Use the same field screen for every comp. If a property has a physical or market mismatch, handle that outside the comp set. If it fails this screen, cut it before you get into cash flow or tax structure.
Screen comps in this order: asset, market, then contract.
| Field | Required Match | Adjust if Different | Exclude if Missing |
|---|---|---|---|
| Technology type | Solar PV only (no wind or hybrid) | - | Yes |
| Development stage | Operating/COD vs. NTP or under construction | - | Yes |
| ISO/RTO or utility territory | Same ISO/RTO or utility territory | Nodal/hub basis risk | Yes |
| Interconnection status | Queue position, study phase, POI, and GIA status | Upgrade cost exposure | Yes |
| Asset age / COD year | Comparable vintage band | Degradation rate delta | Yes |
| Capacity reporting basis | MW-AC vs. MW-DC normalized | DC/AC ratio | Yes |
| Yield basis / operating history | P50/P90 yield on file or historical production track record | Degradation assumptions | Yes |
| Tracker vs. fixed-tilt | - | Output adjustment for tracker configuration | Yes |
| Storage attachment | Solar-only vs. solar-plus-storage | MWh capacity and use case | Yes |
Vintage matters because it shapes degradation and availability. Group comps by COD band. Older assets bring more degradation into cash flow, with typical annual output loss of 0.3%–0.5%, though technical audits sometimes find rates as high as 0.8% [4][5].
Use at least 12 months of actual production data. 24–36 months is better if you want to check degradation trends and availability with more confidence [4]. If the seller can't provide that, ask for direct SCADA or inverter platform access.
One red flag stands out: a gap of more than 5% between P50 and actual output. That can point to yield issues or construction problems [4].
Market and interconnection differences can move price enough to knock out weak comps. ERCOT, PJM, and CAISO each have their own nodal pricing patterns and congestion issues. So a comp from one market doesn't carry over neatly to another unless you normalize it.
For interconnection, zero in on status and upgrade cost exposure. Queue position, study phase, POI, and GIA status can all change how usable a comp is.
For solar-plus-storage comps, record battery MW and MWh capacity, plus the exact use case. That matters because ancillary services and capacity contracts follow different revenue models and different augmentation schedules [3].
On the physical side, capture tracker type and DC/AC ratio. If the setup differs, document the output adjustment for tracker configuration.
Once the asset screen clears, move to PPA terms, counterparty support, and storage revenue.
Once the asset screen clears, the next step is revenue durability. This is where you figure out how steady the cash flow is and where the risk actually lives.
Start with the contract basics: length, start date, end date, and remaining tenor. Then record how the project gets paid. Is pricing fixed, or does it move with an index? Is there an escalation schedule?
Some details look small on paper but can change revenue in a big way. If the contract includes time-of-delivery (TOD) multipliers or shaping provisions, break those out on their own. They can change realized revenue in a material way compared with nameplate output. Also flag curtailment compensation and basis risk, especially in congested nodes where actual settlement prices can come in below the hub price used in the model [7][1].
One clean way to think about it: contracted PPA cash flow and merchant tail cash flow are not the same animal. Merchant tail exposure should be isolated and discounted at a higher rate than contracted PPA revenue [7].
| PPA Type | Typical Tenor | Counterparty Risk | Pricing Stability | Valuation Impact |
|---|---|---|---|---|
| Utility PPA | 15–25 years | Generally lower (investment grade) | High (fixed or escalating) | Supports higher leverage, lower IRR |
| Corporate PPA | 5–15 years | Variable (depends on corporate credit) | Moderate (often indexed) | Requires higher equity, higher IRR |
| Merchant / Tail | N/A (post-contract) | High (market price risk) | Low (spot volatility) | Requires conservative benchmarks |
After term and pricing, look at who pays and what backs the payment.
The offtaker has a huge effect on cash flow stability. Record the offtaker type - utility, cooperative, or corporate - and pull the credit rating. Investment grade is generally defined as BBB or higher (S&P/Moody's) [4]. If the rating falls below investment grade, flag a higher discount rate and tighter payment security.
If the offtaker is a subsidiary, confirm whether a parent guarantee exists. Without one, you're taking the subsidiary's standalone credit risk, and that can be much weaker [4]. Also check for letters of credit or other collateral.
Curtailment terms matter here too. Record who pays when the grid forces a shutdown. A contract with no economic compensation for curtailment can cut into P50/P90 revenue certainty, even if the headline PPA rate looks fine [4].
| Contract Provision | Measurable Field | Valuation Impact |
|---|---|---|
| Credit quality | S&P/Moody's rating | Lower ratings require higher discount rates |
| Parent guarantee | Present (Y/N) | Absence increases default risk for subsidiaries |
| Curtailment terms | Compensation cap (MWh or $) | Uncapped curtailment risk reduces revenue certainty |
| Remaining tenor | Months to expiry | Shorter tenors increase merchant tail exposure |
| Volume structure | Pay-as-produced vs. baseload | Baseload obligations require higher operational buffers |
Storage can make the revenue picture a lot more complicated. The first thing to pin down is simple: Is storage bundled into the solar PPA, or priced on its own? That one distinction changes how you model revenue durability and which discount rate applies to each stream.
Check whether storage economics sit under a separate agreement, such as a tolling agreement, resource adequacy contract, or standalone merchant setup [1]. Each use case - energy arbitrage, ancillary services, or capacity payments - runs on a different revenue model and a different augmentation schedule [3].
| Storage Structure | PPA Tenor Impact | Counterparty Quality | Valuation Adjustment Logic |
|---|---|---|---|
| Fully Contracted (Bundled) | Extends revenue certainty | High (Utility) | Lower discount rate; treated as a stable infrastructure asset |
| Merchant Storage (Unbundled) | No impact on solar PPA | N/A | Higher discount rate for storage; valued on merchant volatility |
| Capacity Payment / Toll | Fixed revenue stream | High (ISO/Utility) | High valuation premium for firm dispatchable capacity |
| Revenue Stacking (Hybrid) | Complex durability | Variable | Requires probability-weighted modeling of multiple streams |
Model each revenue stream on its own before tax, leverage, and capex adjustments. If a comp has several contracted streams mixed with merchant exposure, probability-weight each stream separately instead of rolling everything into one revenue figure [1].
Carry these cash-flow assumptions into tax credit, capital structure, and capex adjustments.
Observed transaction prices can send you in the wrong direction if you don't strip out tax attributes, financing structure, and near-term capex.
Start by recording whether the project used the Investment Tax Credit (ITC) or the Production Tax Credit (PTC). Starting January 1, 2025, technology-neutral credits replaced legacy PTC and ITC structures [6].
You should also log the credit regime, development stage, tax-equity flip status, sponsor buyout rights, and placed-in-service date.
That timing matters. Projects that miss the December 31, 2027, completion deadline can lose federal tax credits, and 2026 construction starts often trade at a discount because buyers price in that risk [6].
Once you've pinned down the tax treatment, move to the balance sheet and purchase structure.
Record whether the deal was an asset sale, an equity sale, or a portfolio/platform trade. Those structures shift which liabilities move with the deal, so mixing them together can warp your comp set [1][2].
Then capture:
The goal is simple: get from the headline number to a clean enterprise value basis.
This is one of the easiest places to get fooled. If one deal comes with near-term inverter replacements and another has newer equipment, the raw EV/MW figures are not apples to apples.
Flag costs tied to inverter replacements, tracker repairs, module remediation, storage augmentation, repowering, and GIA-driven upgrades. Treat immediate costs as purchase-price deductions or escrow items [4]. Then subtract those costs from the headline value before you compare comps.
Here's a simple way to think about the adjustment stack:
| Adjustment Step | Field to Capture | Direction |
|---|---|---|
| Raw EV/MW (observed) | Headline transaction price | Starting point |
| Tax credit adjustment | ITC/PTC vintage, tax-equity flip status, OBBBA risk | ± depending on policy period |
| Leverage adjustment | Debt assumed, cash retained, reserve accounts | Bridge to unlevered EV |
| Capex adjustment | Inverter life, tracker repairs, augmentation, repowering, GIA upgrade costs | Downward (reduces EV) |
| Normalized EV/MW | Clean comp value for benchmarking | Final output |
Pull the GIA and confirm who bears post-close upgrade costs [1].
Normalize these items before source-quality scoring.
Even a well-normalized comp set can fall apart if the data underneath it is shaky. Before you lock in any valuation, you need to know where each number came from and how much trust it earns.
Transaction data does not come with the same level of confidence across the board. Some numbers come straight from signed documents. Others come from press releases, teasers, or secondhand reports. That gap matters. A weak data point can throw off an otherwise usable EV/MW comp.
A simple way to handle this is to sort each comp by source tier: primary documents, secondary research, or unverified claims.
| Data Field | Primary Source | Secondary Source |
|---|---|---|
| Transaction Price | Signed SPA / Audited Financials | M&A Analytics Platforms / Press Releases |
| Asset Capacity (MW) | As-Built Drawings / GIA | Developer Marketing Teasers |
| PPA Terms | Executed PPA Contract | Summary Term Sheets / News Reports |
| Operational History | SCADA Data / Billing Invoices | Monthly Management Reports |
| Tax Credit Status | Tax Equity Closing Docs / Safe Harbor Capacity Documentation | Management Projections |
Standardize currency in USD, capacity in MW-AC or MW-DC with the conversion stated, and transaction dates in U.S. format. For the final database entry, use as-built drawings instead of early project designs. If a deal structure is unclear or pricing looks estimated, either exclude that comp or push it down in rank before it gets into the benchmarking pool.
When documentation is incomplete or the sources don’t line up, ask for direct access to SCADA or inverter platforms to check actual operating data [4]. If two sources still conflict, use 12–36 months of monitoring-system output as the tie-breaker [4].
Use that scoring step to decide whether a comp is audit-ready or not.
Once you classify the source, score the comp before it makes the final cut. Rate it on two things:
That score helps separate clean, audit-ready comps from low-confidence entries.
Outlier review matters just as much. Flag any comp with a production deviation of more than 5% versus modeled P50 before adding it to the set [4]. Do the same for any unexplained production decline or year-over-year performance drop [4]. If a comp looks off, don’t just wave it through and hope the average smooths it out. That’s how bad inputs sneak into a valuation.
Workflow ownership should also be clear. Assign one person to handle data updates, outlier review, and stale-comp removal. And watch PPA tenor closely: flag comps with less than two years of remaining PPA tenor unless a renewal is documented [4].
A solar comp set is only as good as the rules behind it. Those checklists draw the line between deals that belong in the set and deals that don't.
Before you rely on any comp, check the fields that shape price normalization. A defensible comp set needs clear documentation on asset vintage, market, interconnection, contract terms, counterparty credit, tax treatment, and any capex or structure adjustments that change value. Those are the minimum fields for a defensible comp set. If a transaction can't support them, leave it out.
The best comps come from the best-documented transactions. Weak source reliability, incomplete normalization, or missing disclosure in any of these areas makes the comparison harder to defend. If a deal can't support the minimum fields, don't use it as a comp.
A solar comp stops being useful when the project is so different that it can’t serve as a fair benchmark anymore.
Some common deal-breakers are:
At that point, you’re no longer comparing like with like. The comp may still look close on the surface, but the numbers can point you in the wrong direction fast.
Use a risk-adjusted discounted cash flow method instead of simple capacity-based multiples. It gives you a much better read on value, especially when cash flows don’t all carry the same level of risk.
When you look at comps, line them up with assets that have similar revenue mixes and similar regulatory exposure. That part matters more than it may seem at first glance. An asset with merchant exposure should not be valued the same way as one with fully contracted cash flows, because the risk profile is different.
You’ll also want to apply a specific risk premium to merchant tail years. Those later-year cash flows are more exposed to market swings, so they need a tougher discount treatment.
Then stress-test the model against current power curve forecasts. That helps reflect price volatility, congestion, curtailment, and long-term market expectations, instead of assuming a smooth path that rarely shows up in practice.
Put the highest priority on documents that confirm both the financial case and the system’s actual output:
Just as important, spell out every adjustment and assumption in plain language. That paper trail makes the work easier to audit and easier to defend if someone later asks, “How did you get this number?”