Published on
December 26, 2025


Behavioral analytics helps SaaS companies understand how users interact with their products. It goes beyond basic metrics like pageviews, focusing on why users behave the way they do - identifying friction points, predicting churn, and improving retention.
This article reviews eight leading tools for behavioral analytics, each designed to tackle specific SaaS challenges:
Each tool has unique strengths, from event-based tracking to session replays and real-time personalization. Choosing the right platform depends on your team’s goals, whether it’s improving onboarding, reducing churn, or increasing revenue. Below, we break down their key features, integrations, and pricing to help you decide.
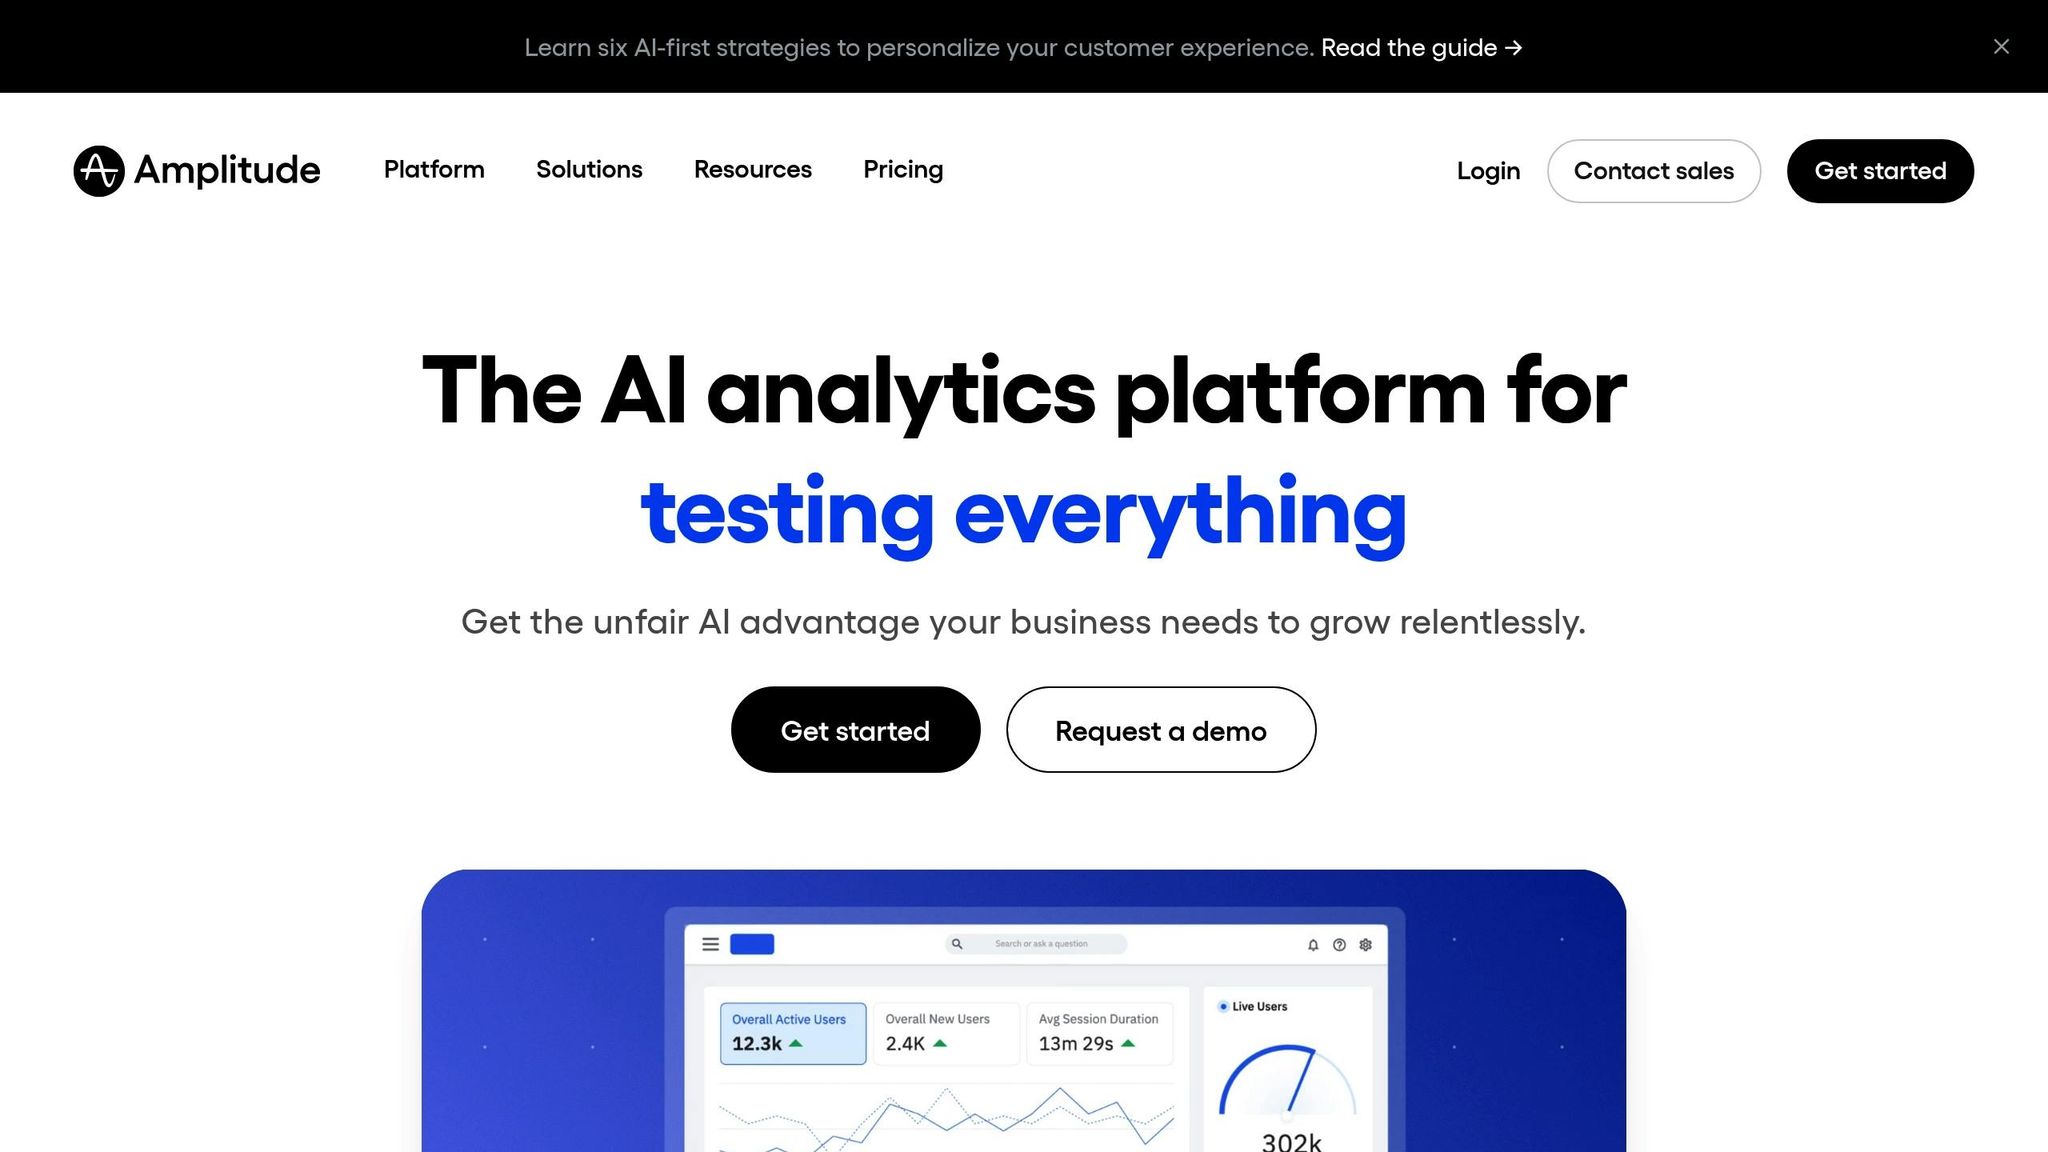
Amplitude shines with its event-based tracking system, linking every user action - like sign-ups or subscription purchases - to an individual’s complete history across devices [12][13]. This real-time tracking allows you to run complex queries instantly, no need for advanced SQL knowledge [9].
One standout tool is Compass, which identifies "aha moments" by revealing specific behaviors that predict long-term retention [11][12]. For example, NBC Universal's VP of Product, Eddie Lee, used behavioral cohorts to analyze streaming app users and found that showing personal watch history on the homepage doubled Day 7 retention rates [13][14]. Amplitude’s root cause analysis goes even deeper, automatically pinpointing the reasons behind conversion rate changes so you can tackle revenue-impacting issues before they grow [9][14].
Beyond tracking, Amplitude equips teams to transform their data into actionable insights that drive personalized user experiences.
With Amplitude Activation, you can create predictive cohorts by combining demographic, behavioral, and algorithmic data. This helps identify groups like the top 10% most likely to activate or the bottom 25% at risk of churning [15]. For instance, UK fintech ClearScore doubled its free-to-paid conversions by targeting high-drop-off cohorts [13].
The Profile API takes personalization a step further, enabling real-time integration of behavioral data and predictions into your product or marketing platforms like Braze [15]. A great example is Malaysian video service iflix, which tested an embedded trailer player against autoplay. The embedded player delivered a 3.5x higher conversion-to-play rate and an 11% boost in first-time views [13].
Amplitude makes setup simple with a single code snippet that unlocks baseline product reporting, dashboards, and charts [14]. It also offers extensive SDK support for JavaScript, iOS, Android, and server-side APIs, along with seamless integrations with tools like Slack, Miro, Notion, and Braze [12][13][11]. If your business already has a data infrastructure, Amplitude’s warehouse-native capability lets you analyze Snowflake data directly without needing to move it [16].
To maintain data quality, Amplitude includes governance features that keep information clean and organized during ingestion [7]. According to Forrester, most companies see a return on their Amplitude investment within six months [7][16].
On top of its analytics power, Amplitude offers flexible pricing options that cater to growing businesses.
Amplitude’s Starter plan is free, supporting up to 50,000 monthly tracked users (MTUs) and including foundational analytics and unlimited feature flags [7][14]. For growth-stage teams, the Plus plan offers additional features like session replay and behavioral cohorts, and it’s available at a 30% annual discount until December 31, 2025 [7]. For platforms tracking over 1 million MTUs, Amplitude provides event-based pricing models [14].
Recognized as the #1 product analytics platform for 12 consecutive quarters, Amplitude has over 2,500 glowing reviews [7][14]. Forrester named it both a "Leader" and "Customer Favorite" in Digital Analytics Solutions (Q3 2025), awarding top scores across 21 criteria [7][10]. Users report an impressive 217% ROI over three years [7].
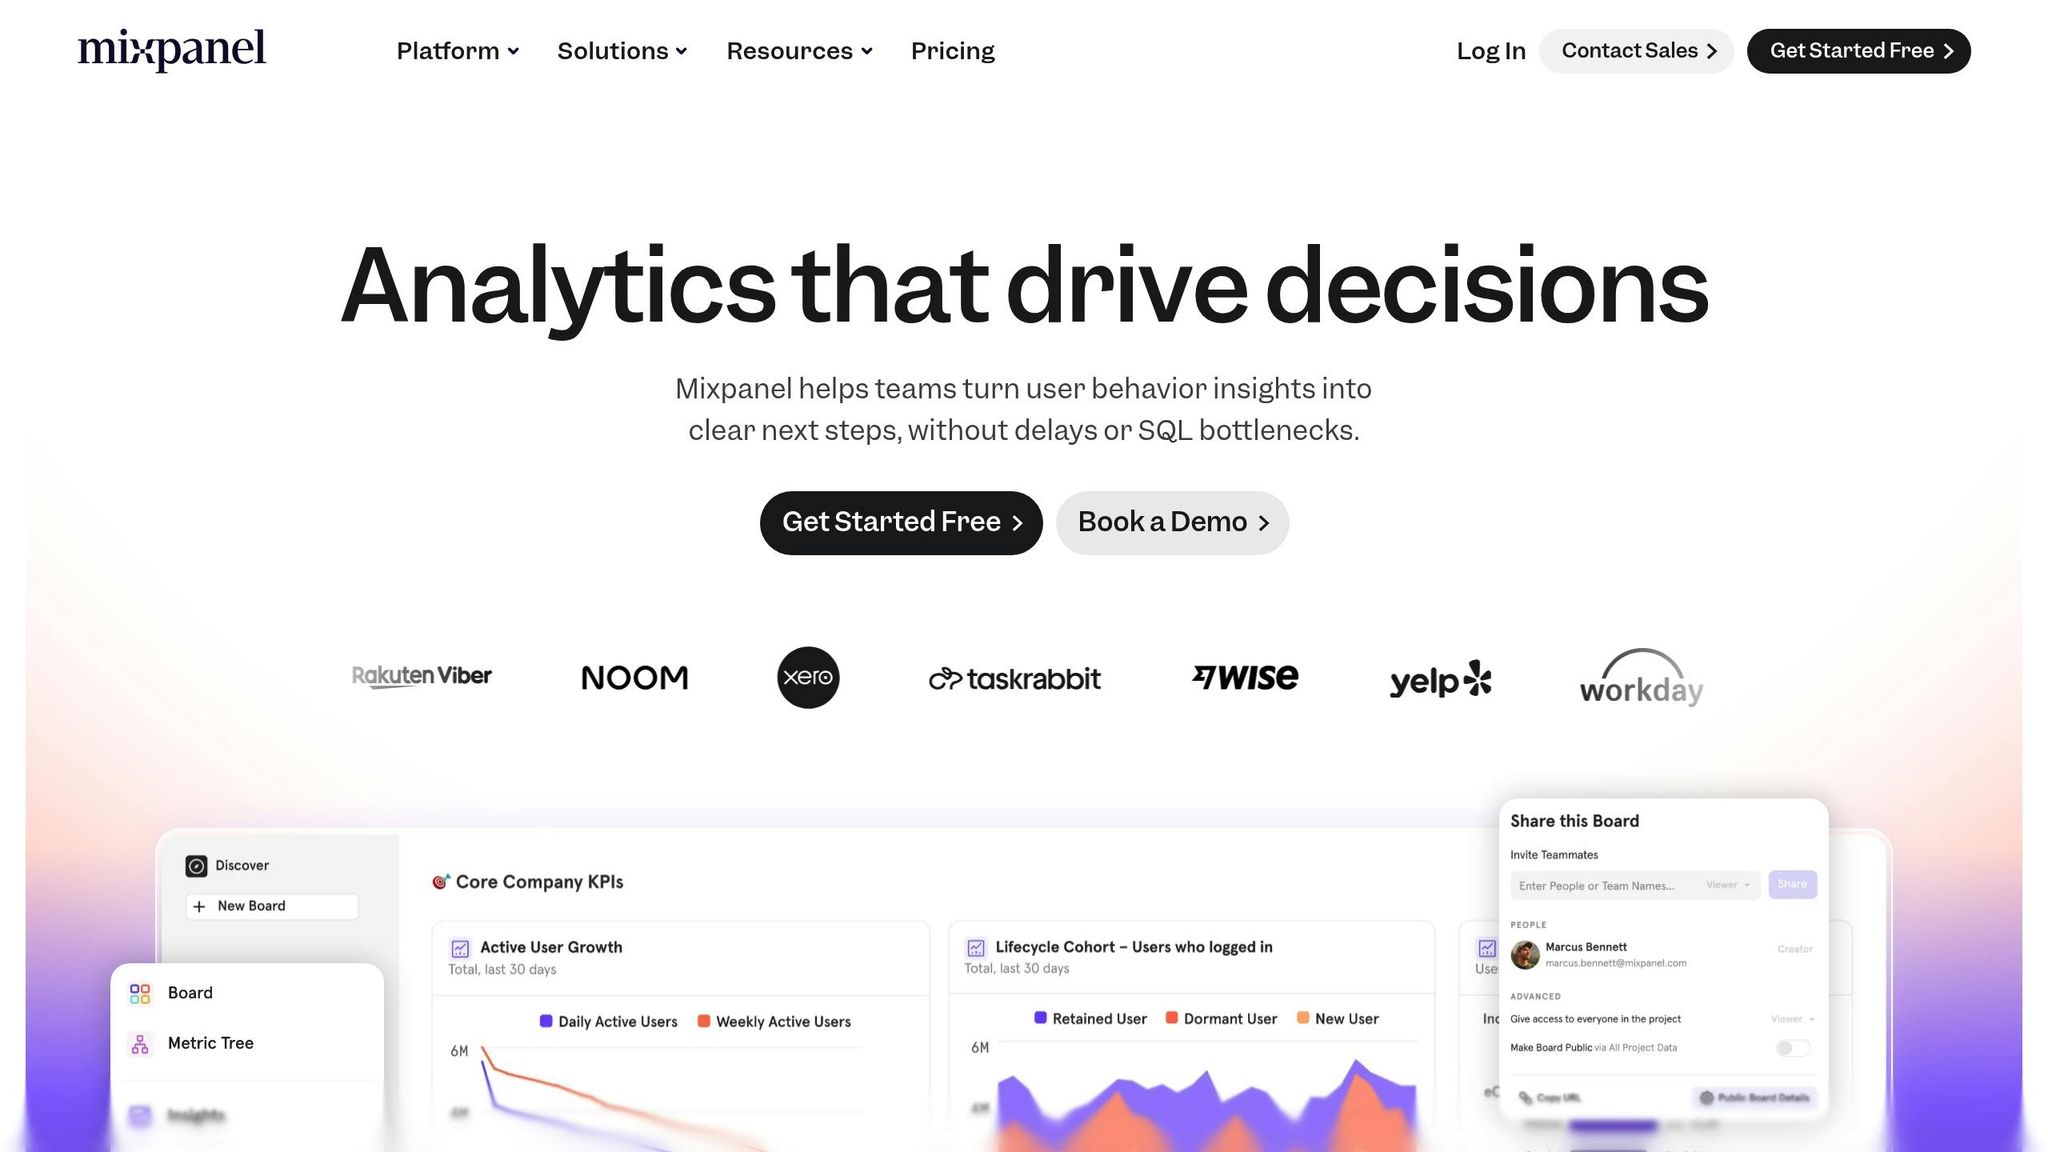
Mixpanel operates on an event-driven framework, combining session replay with in-depth quantitative analytics [19]. Its event-based data model allows you to track specific user actions without needing SQL expertise [19].
Key tools include the Funnels feature, which pinpoints where users abandon the conversion process, and Retention reports that monitor long-term user loyalty [17][20]. The Flows tool provides a clear view of complete user journeys, while Metric Trees align high-level business goals with specific product metrics, promoting collaboration across teams [17][19]. Additionally, Mixpanel offers built-in tools for real-time A/B testing and feature flagging, making it easy to measure the impact of product changes [18].
For example, Lemonade, an insurance provider, leveraged Mixpanel's flow analysis to identify a pre-purchase drop-off. After addressing a technical bug and refining their call-to-action, they increased additional coverage purchases by 50% [20]. Similarly, fintech company Step used Mixpanel's experimentation tools to test product updates, resulting in a 14% increase in direct deposits [18].
"We can now release a feature, hypothesize its impact, and measure results immediately. Being able to do that without having to leave the tool that already has all of our data... just made sense." - Matthew Corley, Head of Engineering [18]
Mixpanel excels in behavioral cohorting, enabling you to group users based on specific actions - or inactions - and deliver targeted experiences at the right time [20]. By combining user properties (like subscription type or industry) with event properties (such as button clicks), you can create detailed journey maps to uncover opportunities for personalization [20].
This approach highlights key moments for strategic upselling and cross-selling, ultimately increasing customer lifetime value [21]. Cohort analysis also helps identify audiences for re-engagement campaigns, allowing for targeted outreach through integrated apps [21].
"The biggest aha moment we had with Mixpanel is that we can see which of our tests - big or small - have the biggest ROI to eToro." - Guy Barkat, Group Product Manager, Growth, eToro [21]
These features make it easier to integrate personalized strategies across your SaaS ecosystem.
Mixpanel doesn’t just offer robust analytics - it also integrates seamlessly with modern SaaS infrastructures, ensuring insights are always at your fingertips. With a quick setup process [22], the platform supports connections to data warehouses like BigQuery and Snowflake, customer data platforms (CDPs) like Segment, and reverse ETL tools [17][23]. Its Warehouse Connectors sync data directly from your existing systems, maintaining a unified source of truth [17][20].
For teams needing immediate insights, Mixpanel’s Autocapture feature automatically collects data points while allowing for more precise tracking as your product evolves [20]. The platform also delivers sub-second query performance, even when handling billions of monthly events [17][23].
"Mixpanel helps us enable our customers for success. What started as a need for simple marketing metrics turned into custom product metrics for more than 100 different stakeholders across the company." - Drew Ashlock, Senior Product Manager [17]
Mixpanel offers a free "Get Started" plan and a specialized Startup Program designed for early-stage teams [17]. For larger organizations, the Enterprise tier includes advanced features like governance tools, SSO/SAML, audit logs, and premium support, making it suitable for handling billions of monthly events [17][22].
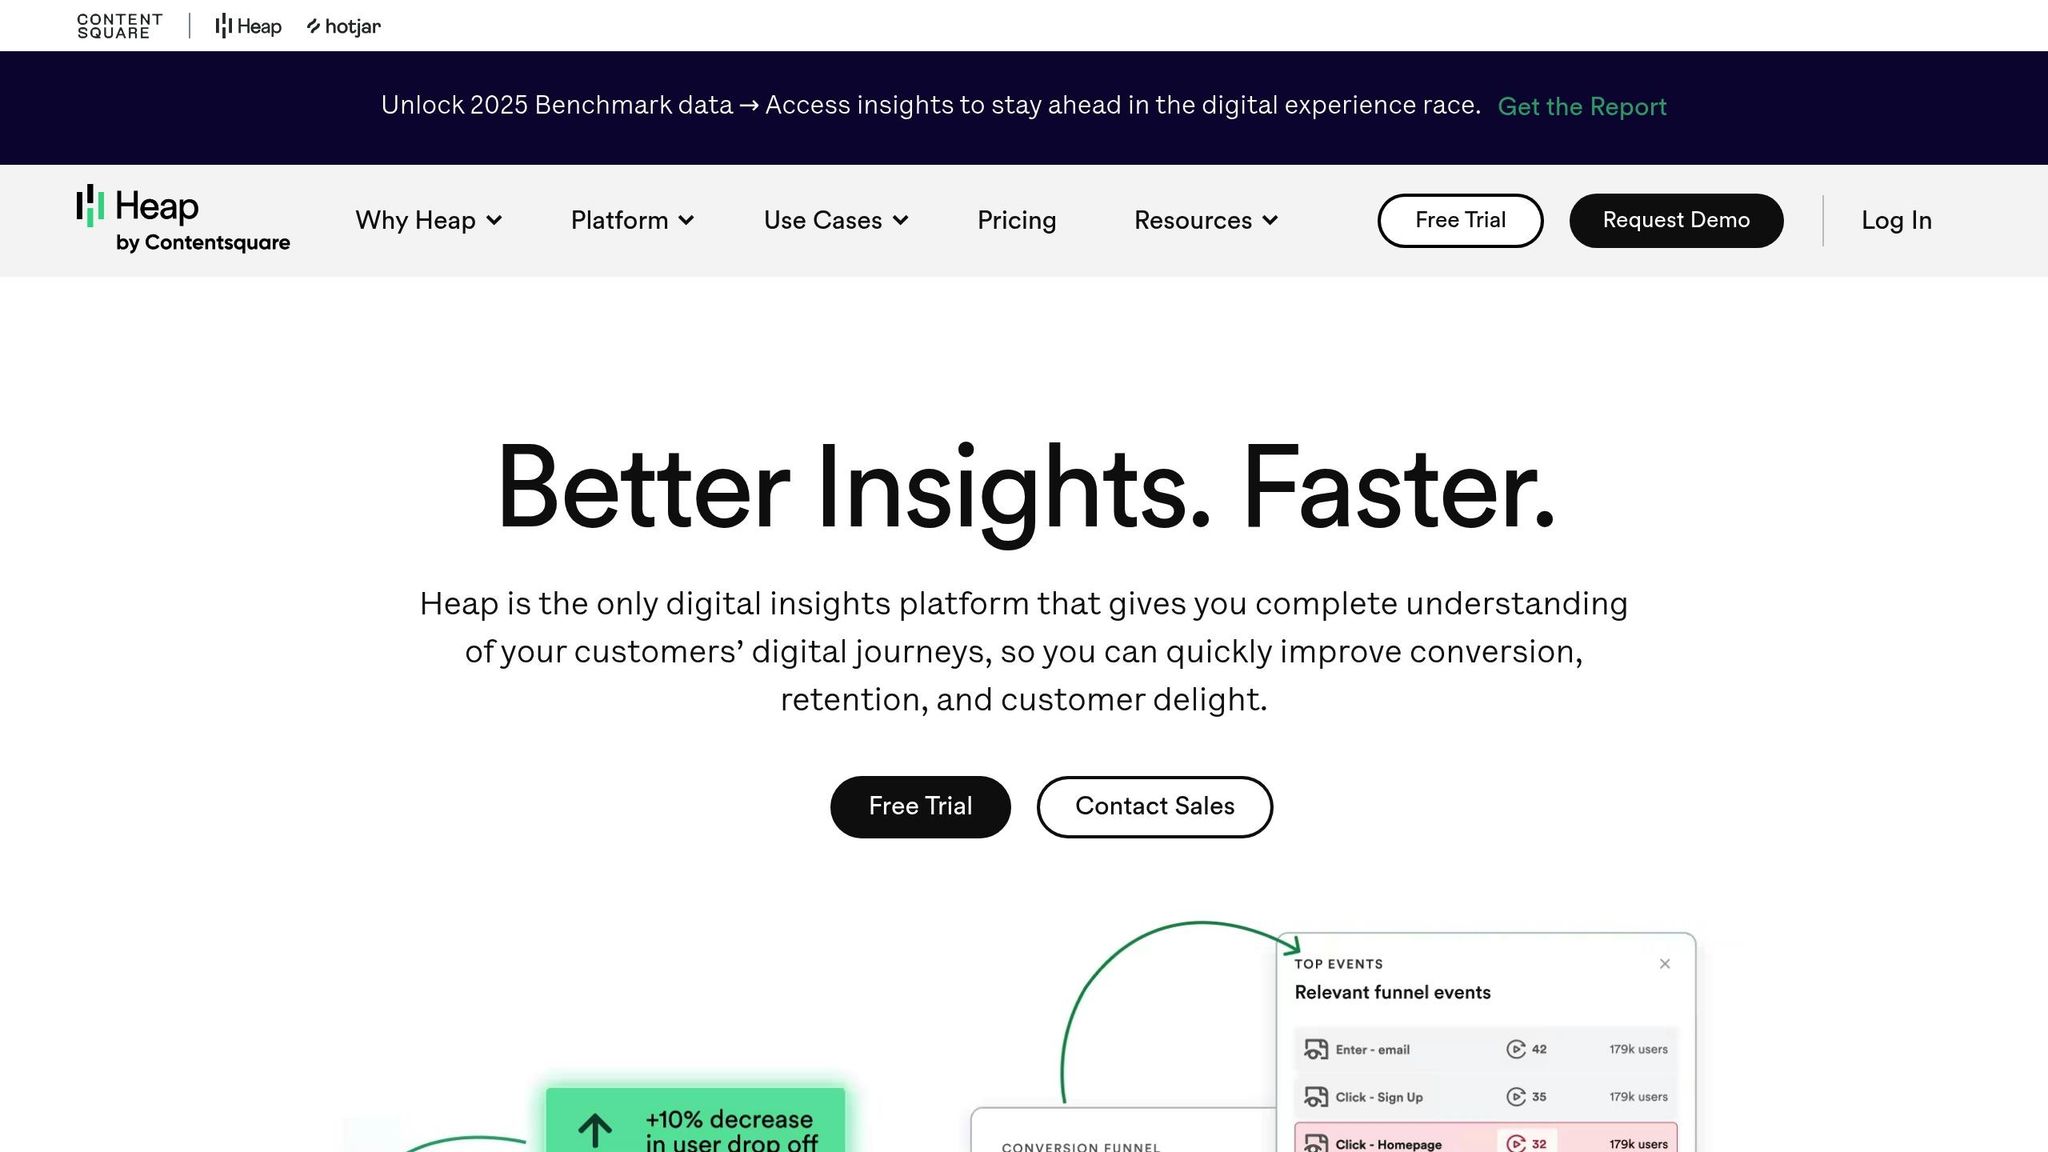
Heap's standout feature, Autocapture, uses a single code snippet to automatically log every interaction on your website or mobile app. From clicks and form submissions to pageviews, it captures everything from day one. This means you can analyze past user behavior, even for events you only recently defined.
Another powerful tool, Heap Illuminate, leverages automated data science to uncover hidden patterns and pinpoint friction points that impact conversion and retention. The platform also includes Effort Analysis, which measures user friction by tracking step interactions, task durations, and visit counts.
For SaaS companies, Account-Based Analysis helps monitor feature adoption, identify upsell opportunities, and flag churn risks. The Session Replay feature takes it a step further by letting you watch session recordings tied to moments of friction, connecting quantitative data with user behavior. For example, Lending Club used Heap's insights to enhance its digital experience, boosting personal loan volume by over $1 million. Similarly, Huel identified friction points that led to a 30% improvement in conversion rates [24].
"With Heap, we could see what worked well and what didn't. Based on this data, we were able to decide which features to focus on, front and center in the new workflow."
- Gireesh Subramanian, Director of Product Management [8]
Heap's detailed analytics make user segmentation more precise, enabling personalized experiences. By grouping users based on actions like feature usage, purchase history, or engagement levels, businesses can deliver tailored interactions. The platform integrates with tools like Appcues, Chameleon, and WalkMe to trigger personalized onboarding flows or feature announcements in real time.
Research from Heap highlights that 59% of conversion funnels miss critical steps, which can hurt conversion rates. To address this, Heap's Step Suggestions feature identifies these gaps. Companies using Heap have reported a 20% increase in product adoption and a 30% boost in conversions [24].
Heap seamlessly integrates with over 100 popular SaaS tools, including Salesforce, HubSpot, and Clearbit for identity enrichment. Through Heap Connect ETL, it also syncs with data warehouses like Snowflake. Its Event Visualizer simplifies event tracking - nontechnical teams can define events just by clicking on elements in the live site, cutting down on engineering involvement.
The platform supports a hybrid tracking model, combining Autocapture with manual event tracking for more sensitive or complex data needs. For mobile apps, Smart Capture efficiently tracks taps and screen views across both native and cross-platform frameworks without requiring manual setup.
As Brandon Walsh, Customer & Product Analytics Manager at Amway, puts it: "Autocapture enables swift iteration by eliminating long tagging delays" [26].
Heap offers a free trial and a free tier tailored for small teams, making it accessible for startups. It has also been recognized by TrustRadius as delivering the "Best Value for Price" [25]. With over 10,000 companies using Heap, one case study even reported monthly savings of $225,000 thanks to data-driven optimizations [24]. For growing and enterprise-level businesses, Heap provides scalable pricing options alongside a governance layer designed to handle large-scale data needs.
Pendo equips SaaS teams with a robust set of tools designed to dig deep into user behavior. Its Core Analytics Suite provides actionable insights through features like Data Explorer, Funnels, Paths, and Retention analysis [28][29]. Adding to this, Pendo's Product Engagement Score (PES) combines key engagement metrics into a single, easy-to-understand score [28][30].
One standout feature is Retroactive Data Capture, which automatically logs user interactions from the moment the platform is installed - no need for manual tagging [28][30]. Another is Session Replay, which records user sessions to pinpoint issues in the user interface [30][32]. To date, Pendo has tracked over 35 trillion events across more than 1 billion users and 50,000 apps [27][31].
Pendo also incorporates AI-Powered Insights, such as "Predict" for identifying churn risks and upsell opportunities, and "Agent Analytics" for evaluating the adoption and effectiveness of AI agents [27][31]. What makes Pendo unique is its ability to pair analytics with personalized In-App Guidance. This includes walkthroughs, tooltips, and guides that directly influence user behavior based on real-time data. For example, MineralTree saw traffic to a key feature increase by 75% to 100% after implementing a Pendo guide [27][31].
"We equate Pendo-ing with driving business decisions. We no longer have to rely on gut instinct, and we can use Pendo data to answer a lot of key questions about our users."
- Chad Parker, Manager of Product Ownership, Global Payments [30]
These features empower teams to create data-driven, user-focused experiences.
Pendo builds on its analytics with tools for delivering highly targeted in-app experiences. Its Segmentation feature allows teams to categorize users based on behavior, CRM data, or feedback [30][32]. These segments can then trigger tailored in-app guides, walkthroughs, or tooltips, addressing specific needs like low feature engagement or particular account characteristics. With its "Orchestrate" functionality, Pendo helps guide users through customized journeys, enabling them to reach key "value moments" more quickly.
A great example of this in action is Osmosis, which used Pendo's personalized guidance to optimize its onboarding process, leading to a 35% jump in free-to-paid conversions [27][31]. By combining detailed behavioral data with precise in-app support, SaaS teams can provide users with the help they need, exactly when they need it.
Getting started with Pendo is straightforward. For web applications, teams can use a simple JavaScript snippet, while internal employee apps can be set up with the Pendo Launcher browser extension [28][29]. Its no-code event tagging feature allows teams to track user interactions without needing developer support [30].
Pendo also supports native mobile apps for seamless cross-platform tracking and integrates with major tools like Salesforce, HubSpot, Snowflake, and BigQuery. This makes it easier to connect data across systems and eliminate silos.
"Pendo is our platform for measuring, end-to-end, feature and service adoption, and helping bolster each of those numbers with in-app guides or retargeting tactics."
Pendo offers a free tier for businesses with up to 500 Monthly Active Users (MAU), making it a great starting point for smaller teams [30][32]. For those ready to scale, the Starter Plan is priced at approximately $7,000 per year for up to 2,000 MAUs. Beyond that, the Growth and Portfolio Plans are custom-priced, with market estimates ranging from $17,000 to $132,000 annually. The median pricing typically falls around $47,000 [32].
With a 4.5/5 rating from over 1,500 reviews, Pendo has established itself as a trusted platform for businesses looking to grow [27].
FullStory goes beyond just tracking user behavior - it dives into the causes of user friction with its advanced AI-powered insights. One standout feature, Fullcapture Technology, records every user interaction from the very start, eliminating the need for manual tagging or coding [3][6].
The platform’s Session Replay delivers accurate, DOM-based reconstructions of user sessions. It automatically detects Frustration Signals like "rage clicks", "dead clicks", and "thrashed cursors", helping teams quickly identify where users are struggling [6][34][35]. Another game-changing tool, StoryAI, acts as an AI analyst, summarizing data from multiple sessions and highlighting patterns to help resolve issues faster [3][34]. With features like conversion funnels, heatmaps, user journey maps, and audience segment analysis, FullStory provides everything you need to analyze and improve the user experience [34].
For example, in 2024, real estate platform Wahi used FullStory to boost conversion rates by 100% year-over-year. They achieved this by analyzing user journeys, identifying bugs, and reducing median bug resolution time to less than 48 hours [35].
"StoryAI's multi-session summaries streamline issue resolution. No more hours of replays - FullStory's StoryAI instantly pinpoints where our users struggle, saving us time, improving our decisions, and helping us fix friction."
FullStory also shines when it comes to personalization. With FullStory Anywhere, the platform can deliver real-time personalized content based on user behavior [3][33]. Its advanced segmentation tools allow businesses to create precise user cohorts and compare behaviors across different audience groups [37][34].
A great example of its impact is Finicity, a financial data aggregator. By using FullStory's privacy-first settings, they identified 54 bugs while keeping data secure, resulting in an 80% reduction in ticket resolution time and a 15% increase in funnel conversions [3][35]. Similarly, Endeavour Group saw a 27% drop in rage clicks and a 13% increase in add-to-cart actions after addressing key friction points in their digital experience [35].
FullStory integrates seamlessly with popular SaaS tools like Google Analytics, Salesforce, Optimizely, Jira, Slack, Zendesk, and Intercom [6]. Its "Privacy by Design" framework, which includes built-in PII redaction, ensures compliance with regulations like GDPR and CCPA [6]. The platform also holds important certifications, including SOC 2 Type II, ISO 27001, and ISO 42001 [6].
Teams can embed session replays directly into support tickets via tools like Jira or Salesforce, giving agents the context they need and reducing engineering escalations [6][35]. For instance, ServiceTitan saved more than 100 hours by using FullStory’s automation features to quickly identify and resolve user experience issues [3].
FullStory offers a free plan that includes essential features like session replay and heatmaps, making it a great option for startups or businesses utilizing fractional CFO services to manage growth [6][36]. For larger organizations, the platform provides custom-priced Business and Enterprise plans, along with a 2-week trial upon request [6][36]. Its pricing structure is flexible, catering to businesses of all sizes and growth stages.
ChartMogul zeroes in on revenue outcomes by connecting user behavior with financial metrics like Monthly Recurring Revenue (MRR) and Annual Run Rate (ARR) [38]. It breaks ARR into categories - New Business, Expansion, Reactivation, Contraction, and Churn - offering a clear view of the factors driving growth [38].
The platform also tracks critical retention metrics, including customer retention, Net Revenue Retention (NRR), and Gross Revenue Retention (GRR) [38]. For businesses with an Average Revenue Per Account (ARPA) exceeding $1,000 per month, around 40% of new revenue stems from upselling and cross-selling [38]. Interestingly, 40% of SaaS companies with ARR between $15M and $30M experience "negative churn", where revenue gained from expansions surpasses revenue lost [38].
"In reality, for every B2B SaaS business retention becomes the biggest growth driver in a way. So it is worth focussing on retention really from day one."
- Nick Franklin, Founder & CEO, ChartMogul [38]
ChartMogul doesn't just excel at analytics - it also simplifies integration. It connects effortlessly with major payment gateways like Stripe, Braintree, Chargify, Recurly, and PayPal, automating the consolidation of billing and customer data [42]. The platform accommodates complex data schemas and custom configurations, allowing teams to focus on insights rather than logistics [40]. Since its launch in November 2014, over 2,500 SaaS companies have adopted ChartMogul [39][42].
Its user-friendly interface ensures that even non-technical team members can interpret complex metrics [39]. For advanced users, the platform provides detailed developer documentation to integrate normalized data with tools like Snowflake [40]. ChartMogul’s infrastructure is built for scale, managing datasets with over a billion rows while maintaining top-notch performance [41].
"I love how ChartMogul makes complex data approachable for everyone in our team, regardless of their data literacy."
- Christian Folmann Hempler, Customer since December 2021 [39]
ChartMogul offers flexible subscription plans tailored to both startups and established enterprises [42]. Data from over 2,100 SaaS companies reveals that businesses with ARR between $1M and $3M can achieve an annual growth rate of 192%, though only 13% of startups manage to hit $10M ARR within a decade [43].
To support growth, ChartMogul includes advanced tools like customer merging, subscription connections, and MRR editing, ensuring data accuracy during scaling [42]. Additionally, companies with net retention rates exceeding 100% grow 1.8 to 2.3 times faster than those with lower retention rates [38][43].
Google Analytics 4 takes a detailed approach to tracking user behavior by treating every interaction - like clicks, scrolls, and downloads - as a distinct event [49][50]. This event-based model provides a clear picture of how users interact with your product's features.
The platform's Explorations Hub introduces advanced reporting tools that dig deeper than basic metrics. For example, funnel explorations help pinpoint where users drop off during processes like signups or onboarding, while path explorations map out the steps users take before converting - or churning [46][47]. The User Explorer feature allows teams to analyze activity streams for specific user groups, offering valuable insights into their behavior [46].
GA4 also uses AI to predict outcomes like churn or purchase likelihood without requiring complex modeling [44][6]. For SaaS companies in growth mode, this means they can address potential issues before they escalate. Combined with its ability to integrate seamlessly with major SaaS platforms, GA4 equips teams with the tools they need to make informed decisions based on detailed user data.
Setting up GA4 is straightforward for popular platforms like WordPress, Wix, HubSpot, and Shopify. Features like User-ID and Google Signals ensure you get a unified view of user behavior across sessions, devices, and platforms [44][45].
GA4 also integrates effortlessly with Google's ecosystem, including Ads, Search Console, and AdMob. Additionally, it supports third-party tools like Salesforce Marketing Cloud, which can automatically tag emails with UTM parameters for tracking user activity [48]. For more advanced needs, GA4 enables BigQuery exports, allowing custom SQL queries that combine GA4 data with internal systems for deeper analysis and long-term storage [47].
The standard version of GA4 is free, making it a great choice for businesses in their growth phase [52]. As your company expands, BigQuery integration lets you handle large datasets for advanced analysis without being limited by the platform [51]. For enterprises with more extensive needs, Analytics 360 - starting at $150,000 annually - offers expanded capabilities, such as 125 custom dimensions, 400 audiences, and the ability to analyze up to 50 billion events per day without sampling [46].
Since Universal Analytics stopped processing new data on July 1, 2023 [44], migrating to GA4 is now a must for SaaS companies still relying on the older system. GA4's event-based model, combined with its privacy-focused features like cookieless tracking and behavioral modeling, ensures compliance with regulations like GDPR and CCPA while offering a forward-looking analytics solution [44]. Plus, its scalability ensures it can keep up as your business grows.
Statsig combines product analytics, feature management, and experimentation into one platform, streamlining the process of understanding the immediate behavioral effects of feature releases - all without the need to switch between tools [56][57].
The platform includes custom funnel analysis to identify where users drop off, user journey mapping to visualize actions before and after key events, and automatic tracking of retention metrics [54][56]. With advanced segmentation, you can dive into specific user groups - like "power users" or those at risk of churning - to uncover unique engagement trends. Additionally, session replays tied to feature flags and experiments help identify and address user friction in real time [57].
Statsig handles over 1 trillion events daily, maintains 99.99% uptime, and processes evaluations in under 1 millisecond [57][58]. For instance, Brex cut the time data scientists spent on analytics by 50% and reduced costs by 20% by consolidating their analytics and experimentation with Statsig [57]. Similarly, Notion boosted its experimentation speed by 30×, launching over 600 features using Statsig’s feature flags, which significantly impacted their growth metrics [57].
This powerful platform sets the stage for real-time, personalized product improvements.
Statsig makes personalized user experiences possible by segmenting users based on their real-time behavior. Its Dynamic Configs feature allows for on-the-fly personalization adjustments - no additional code deployments required [54][58]. For example, Ancestry scaled its experimentation from 70 to over 600 annual tests, delivering tailored experiences to 3.5 million customers [57].
"Integrating experimentation with product analytics and feature flagging has been crucial for quickly understanding and addressing our users' top priorities."
– Dave Cummings, Engineering Manager, ChatGPT, OpenAI [55][56]
Beyond personalization, Statsig’s seamless integration capabilities make it easy to fit into your existing tech stack.
Statsig is built for quick setup, offering over 30 SDKs for both client-side (JavaScript, React, iOS, Android) and server-side (Node.js, Python, Go, Ruby, Java, PHP) environments. It also comes with pre-built connectors for tools like Segment, mParticle, Rudderstack, Hightouch, Slack, Webflow, and Shopify [53][59].
Its Warehouse Native feature allows you to run analytics directly on your existing data warehouses, like Snowflake or BigQuery, without needing ETL processes [53][56]. This approach simplifies data management while maintaining security and governance.
"We evaluated Optimizely, LaunchDarkly, Split, and Eppo, but ultimately selected Statsig due to its comprehensive end-to-end integration."
– Don Browning, SVP, Data & Platform Engineering [55]
Statsig offers a streamlined solution by combining multiple tools into one platform, making it not only efficient but also cost-effective.
The free tier includes 2 million events per month, unlimited feature flags, and 50,000 session replays - ideal for startups and small teams [60]. As businesses expand, the pricing scales with usage, with enterprise plans tailored for larger operations [60].
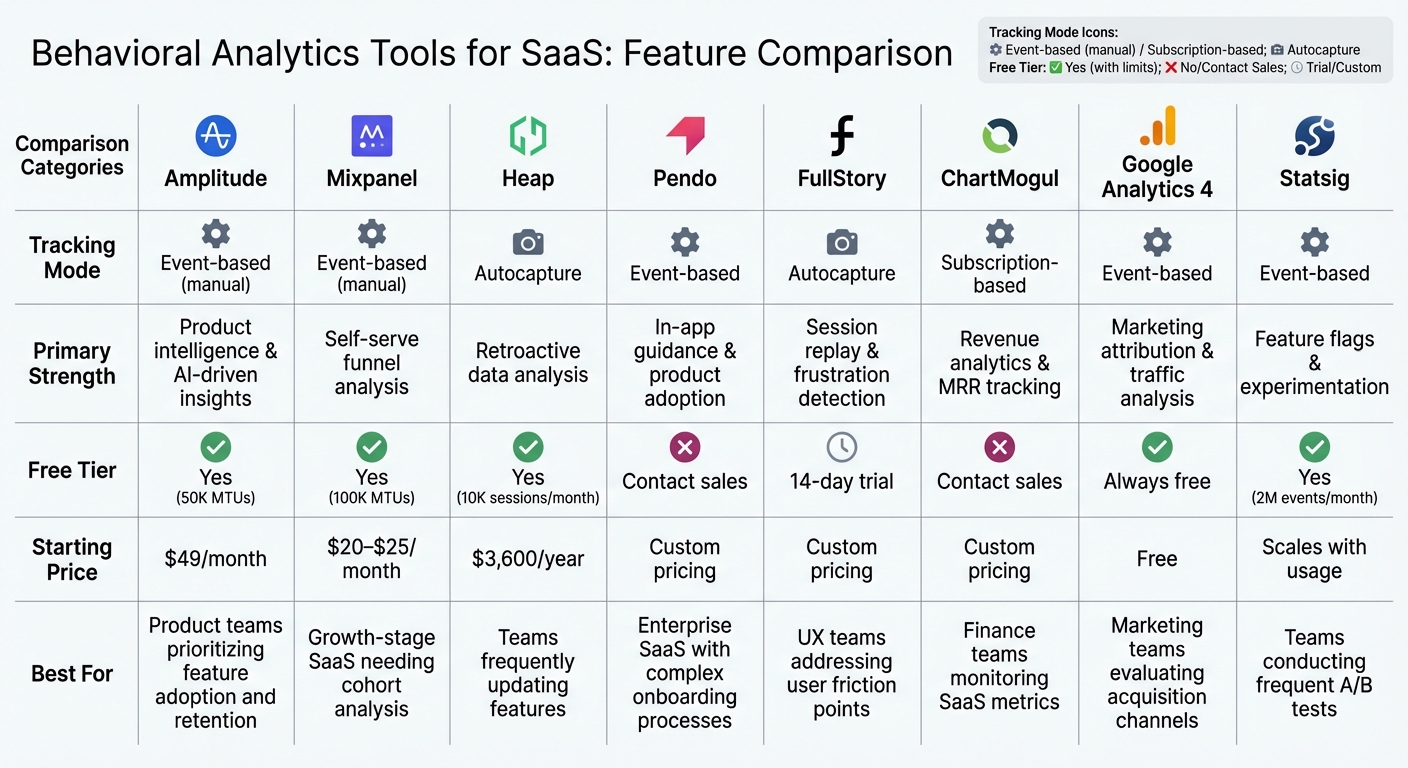
Comparison of 8 Leading Behavioral Analytics Tools for SaaS
This table breaks down the key features of various platforms, helping you identify the one that aligns best with your SaaS goals.
| Tool | Tracking Mode | Primary Strength | Free Tier | Starting Price | Best For |
|---|---|---|---|---|---|
| Amplitude | Event-based (manual) | Product intelligence & AI-driven insights | Yes (50K MTUs) | $49/month | Product teams prioritizing feature adoption and retention |
| Mixpanel | Event-based (manual) | Self-serve funnel analysis | Yes (100K MTUs) | $20–$25/month | Growth-stage SaaS needing cohort analysis |
| Heap | Autocapture | Retroactive data analysis | Yes (10K sessions/month) | $3,600/year | Teams frequently updating features |
| Pendo | Event-based | In-app guidance & product adoption | Contact sales | Custom pricing | Enterprise SaaS with complex onboarding processes |
| FullStory | Autocapture | Session replay & frustration detection | 14-day trial | Custom pricing | UX teams addressing user friction points |
| ChartMogul | Subscription-based | Revenue analytics & MRR tracking | Contact sales | Custom pricing | Finance teams monitoring SaaS metrics |
| Google Analytics 4 | Event-based | Marketing attribution & traffic analysis | Always free | Free | Marketing teams evaluating acquisition channels |
| Statsig | Event-based | Feature flags & experimentation | Yes (2M events/month) | Scales with usage | Teams conducting frequent A/B tests |
Tracking mode plays a crucial role in implementation. Tools like Heap and FullStory use autocapture, automatically recording all user interactions without needing manual setup. This allows teams to define events retroactively and access historical data instantly. On the other hand, platforms like Amplitude and Mixpanel require explicit event tracking, which offers precision but demands ongoing engineering support.
Integration ecosystems differ significantly across platforms. Many tools connect with data warehouses, CRM systems, and other software to streamline data management. For example, FullStory links frustration signals - such as rage clicks - to Jira tickets and Slack alerts, enabling real-time troubleshooting [6].
Pricing models highlight varying approaches to value. Amplitude’s free tier supports 50K monthly tracked users and claims a 217% ROI within three years, with a six-month payback period [7]. Mixpanel offers a generous free tier for 100K MTUs, making it ideal for early-stage companies [5][6]. Meanwhile, enterprise-focused platforms like Pendo, FullStory, and ChartMogul require custom pricing tailored to specific needs.
These insights, combined with our in-depth tool reviews, aim to help you select the platform that best supports your personalized growth strategy.
Bringing together behavioral analytics and financial systems can turn user actions into clear financial insights. By linking platforms like Amplitude or Mixpanel with tools such as Stripe, Salesforce, or BigQuery, businesses can translate user events into actionable metrics like Lifetime Value (LTV) and Customer Acquisition Cost (CAC) payback periods [1]. This integration empowers finance teams to calculate unit economics by blending event data with transactional records [1].
McKinsey & Company highlights the power of behavioral insights, noting that companies leveraging such data outperform competitors by 85% in sales growth and over 25% in gross margin [13]. Studies back this up, showing returns exceeding 200% over three years for organizations that have embraced these integrations [7]. These gains stem from identifying key behavioral patterns - like "aha moments" that predict retention on Day 30 - and channeling resources to encourage these behaviors.
This approach lays the foundation for operational integration. By merging behavioral insights with financial planning, Phoenix Strategy Group's data engineering and FP&A services create the infrastructure needed to align user behavior with financial outcomes. Data engineering teams develop pipelines that feed behavioral events into business intelligence platforms, enabling FP&A professionals to move from reactive reporting to proactive decision-making. For instance, by segmenting users into behavioral cohorts based on high-value actions, finance teams can anticipate upsell opportunities and flag accounts at risk of churn - before these issues hit the profit and loss statement [1][2].
This strategy transforms static budgeting into dynamic, driver-based models that link forecasts directly to behavioral KPIs. For example, if Day 7 retention improves by 5%, the model can automatically adjust projected Annual Recurring Revenue (ARR). As Rama Krishna, Strategic Finance Advisor at Drivetrain, explains:
"The budget isn't just another financial document; it's the numerical expression of your company's strategy. When CFOs methodically connect each budget line to strategic initiatives, they transform budgeting from an accounting exercise into a powerful mechanism." [61]
To achieve this, connect behavioral tools to financial systems by capturing server-side events - like order fulfillment or subscription renewals - and syncing them with user activity. This approach enables precise Effort Analysis, helping prioritize engineering fixes that deliver the greatest impact [1][2]. By seamlessly integrating behavioral and financial data, businesses can enhance retention, lower CAC, and unlock greater customer value.
Behavioral analytics tools have reshaped how SaaS businesses understand and serve their users. Platforms like Amplitude and Mixpanel excel at tracking user actions and creating targeted cohorts, while Heap's autocapture ensures no interaction goes unnoticed by automatically recording every event. Tools such as FullStory and Pendo go a step further, highlighting issues like rage clicks and friction points, while also enabling in-app guidance precisely when users need it. Even Google Analytics 4 proves invaluable by identifying high-traffic pages with conversion challenges that demand attention.
What sets these tools apart is their ability to uncover not just what users do, but why they do it. By blending hard numbers with qualitative insights - like session replays and heatmaps - SaaS companies can address friction points before they escalate into revenue losses.
The business impact is clear. For example, Lyyti.com saw a 93.71% increase in lead generation visits after using heatmaps to resolve pricing page confusion [4]. Similarly, Pizza Hut boosted total transactions by 6.5% by optimizing their digital experience [3]. These real-world examples underscore how understanding user behavior can directly fuel growth.
But the benefits don’t stop at product optimization. For growth-stage SaaS companies, linking behavioral analytics with financial planning unlocks deeper insights. By connecting user behavior data with financial models, businesses can forecast revenue based on retention trends and feature adoption. Phoenix Strategy Group exemplifies this by integrating FP&A with data engineering to turn behavioral insights into predictive financial models.
The key is choosing the right tools for your goals: autocapture for retroactive analysis, session replays to uncover friction, or in-app support to enhance user engagement. By leveraging these insights, SaaS companies can craft personalized experiences that drive engagement, reduce churn, and fuel sustainable growth.
When choosing a behavioral analytics tool for your SaaS business, it’s essential to start by pinpointing the key user actions you need to monitor. These could range from sign-ups and feature usage to churn indicators. Opt for a platform that can automatically track these events with minimal manual effort. This ensures your data remains accurate and comprehensive as your business grows.
Make sure the tool integrates smoothly with your existing systems, such as CRMs or marketing platforms. A good platform should offer real-time dashboards, cohort analysis, and segmentation to deliver actionable insights. Don’t overlook the importance of data privacy and compliance - features like GDPR and CCPA support are crucial for safeguarding customer information.
Also, evaluate factors like scalability, pricing, and support. The tool should manage increasing data volumes efficiently without sacrificing performance. Look for transparent pricing that aligns with your business stage, and ensure the platform offers responsive customer support or consulting services to help you turn insights into effective strategies for growth.
Integrating behavioral analytics into your financial systems can turn user behavior data into actionable insights that drive revenue. By weaving in metrics like activation rates, feature adoption trends, churn risk scores, and expansion signals into your budgeting and forecasting processes, you can predict Monthly Recurring Revenue (MRR) and Customer Lifetime Value (CLV) with sharper precision. This approach moves you beyond relying solely on historical averages, enabling smarter, data-driven decisions.
Behavioral analytics also provides finance teams with a deeper understanding of the why behind user actions. This insight allows for real-time modeling of how product changes impact finances, better allocation of marketing budgets, and more accurate cash flow adjustments. A unified data stack eliminates fragmented analytics, offering a single source of truth for both product-level KPIs and financial performance. This streamlined feedback loop enhances decision-making, minimizes risks, and supports sustained growth and profitability.
Phoenix Strategy Group can help design and implement this integration by leveraging their expertise in data engineering and FP&A. Aligning product usage data with financial planning gives you a clearer picture of how user interactions convert into revenue, equipping you to scale effectively, secure funding, and prepare for a successful exit strategy.
When it comes to creating tailored experiences in the SaaS world, a few standout tools lead the way: Optimizely Personalization, FullStory Anywhere, and VWO’s personalization suite. Each of these platforms focuses on turning user behavior into actionable insights, delivering experiences that feel custom-made.
These tools help SaaS businesses turn data into engaging, personalized experiences that not only capture attention but also improve conversion rates.