Published on
May 27, 2026


Behavioral segmentation is the key to reducing churn and driving growth in SaaS. Instead of relying on static demographic data, this approach focuses on what users do - their product usage, engagement patterns, and lifecycle stage. Here's why it works and how to use it effectively:
Behavioral segmentation isn't just about data - it's about linking user actions to clear financial outcomes. Companies that implement these strategies see measurable improvements in retention, revenue, and growth.
SaaS Behavioral Segmentation: Churn Risk & Retention Strategies by User Segment
Behavioral segmentation helps identify churn risks by focusing on what users actually do, rather than relying on demographic data. Treating all users the same can hide potential problems, but grouping them based on behavior allows for targeted interventions at the right time.
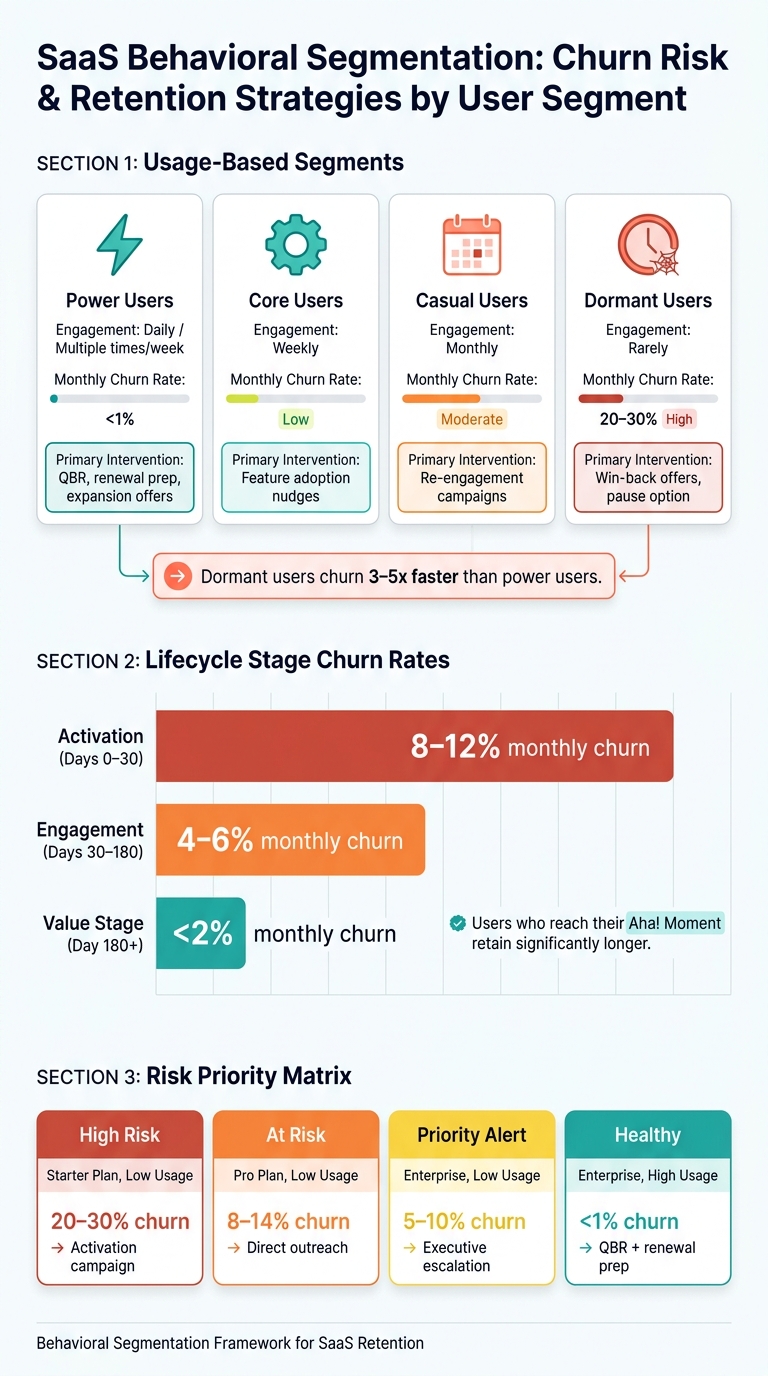
A straightforward way to segment users is by how often and deeply they interact with your product. A common framework divides accounts into four categories:
These segments are strong predictors of retention. For instance, users in the lowest engagement tier churn 3–5 times faster than those in the highest tier [1][4][6].
It's also important to track how many core features users are adopting. Accounts that rely on just one feature may seem active but are more vulnerable than accounts with broader usage. Identifying your product's "sticky" features - the ones most closely tied to retention - can help you spot at-risk users. For example, segmenting users based on whether they've adopted these features provides a clearer view of potential churn risks [2][4][8].
Beyond how often users engage, their stage in the customer lifecycle also plays a big role in churn risk.
A user's position in their journey is just as important as their usage patterns. Breaking the lifecycle into three stages - Activation (Days 0–30), Engagement (Days 30–180), and Value (Day 180+) - can reveal different churn dynamics. For instance, monthly churn rates are typically 8–12% in the first two months, drop to 4–6% in months three to six, and fall below 2% after the first year [3][6].
Within the Activation stage, two key groups emerge: Struggling Onboarders and New & Engaged users. While they may look similar on paper, their behaviors differ significantly.
"Activated vs. not-activated users are always two different populations. They look the same demographically. They behave nothing alike." - Atticus Li, Applied Experimentation Lead, NRG Energy [1]
Struggling Onboarders need extra support, like friction-reduction flows or direct outreach. Meanwhile, New & Engaged users are ready for more advanced guidance, such as feature deep-dives. Treating both groups the same can lead to missed opportunities - and higher churn for those struggling to onboard.
In addition to lifecycle stage, understanding whether users have achieved value from the product can further refine risk assessment.
Tracking whether users have reached a meaningful milestone - often called the "Aha! Moment" - is crucial. This milestone, like completing a specific action or achieving a desired outcome, signals that a user has experienced real value from your product. Users who fail to reach this point within a set timeframe are at higher risk of churn, no matter how long they've been a customer [3].
Combining various signals, such as declining usage, missed payments, or increased support tickets, can help create an effective risk scoring system. For example, in February 2026, a healthcare SaaS company with $22M ARR used RFM (Recency, Frequency, Activity) segmentation to identify that users who didn’t complete a "Connect EHR → Create Form" sequence within 14 days were likely to churn. By optimizing this activation path, they reduced churn by 23% in just 90 days [3]. It's worth noting that payment failures alone account for 20–40% of SaaS cancellations - a segment often overlooked but easily recoverable with the right actions [5].
Monitoring engagement trends, rather than relying on static scores, is key to proactive retention strategies:
"Static health scores are dead. In 2026, health is a vector, not a point. You must track the 'Engagement Velocity' - is the user expanding or decaying week-over-week?" - Jake McMahon, Growth Consultant at ProductQuant [3]
The table below illustrates how combining plan tier with usage levels can prioritize interventions effectively:
| Segment | Plan Tier | Usage Level | Monthly Churn Rate | Primary Intervention |
|---|---|---|---|---|
| High Risk | Starter | Low | 20–30% | Activation campaign, onboarding nudge [6] |
| At Risk | Pro | Low | 8–14% | Health check, direct outreach [6] |
| Priority Alert | Enterprise | Low | 5–10% | Executive escalation [6] |
| Healthy | Enterprise | High | <1% | QBR, renewal prep [6] |
Tailoring retention strategies to specific user behaviors is critical for success. By segmenting users into actionable groups, you can craft interventions that address their unique needs. A generic approach won’t work - what keeps a power user engaged won’t resonate with someone who hasn’t logged in for over a month.
Power users aren’t just loyal - they’re your biggest opportunity for growth. These high-usage customers are far more likely to convert on expansion offers, with a conversion rate of 60–70%, compared to just 5–20% for new acquisitions [2]. That’s a massive difference in effort-to-return ratio.
To keep these users engaged, focus on deepening their connection with your product while recognizing their loyalty. Here are some ways to do that:
It’s also important to rethink how you measure success with this group. Move beyond basic metrics like logins. Instead, provide an ROI dashboard that highlights the tangible benefits they’ve gained - like hours saved, revenue recovered, or tasks automated. This reinforces the value of staying engaged.
When engagement starts to decline, timing is everything. For high-value accounts, personal outreach within 7 days is far more effective than automated emails. On the other hand, for lower-value dormant users, a cost-efficient automated win-back campaign works better [3][7].
One strategy that’s often overlooked is offering a "Pause" option. If users cite low usage as a reason for leaving, let them pause their account for 60 days at no charge. This preserves their data and settings, making reactivation about five times easier than starting from scratch. It also reduces the psychological hurdle of canceling [3].
Here’s how you can match win-back offers to specific reasons for churn:
| Reason for Leaving | The Win-Back Offer | Psychological Lever |
|---|---|---|
| Too expensive | 50% off for 3 months | Value Recovery |
| Not using enough | Pause account for 60 days | Moat Preservation |
| Too complicated | Free 1-on-1 training session | Competence Validation |
| Missing features | Roadmap preview + beta access | Vision Alignment |
Segmented campaigns like these can drive 760% more revenue compared to general email blasts [10]. Additionally, reason-based win-backs can intercept 40–50% of churn attempts [3].
While re-engagement focuses on experienced users, onboarding is all about securing long-term retention from the start. The key is to guide new users toward their first meaningful success with your product.
"The primary goal of onboarding is not to showcase every feature. It is to eliminate friction and guide the user to perform the one or two key actions that unlock the core value of your product." - Smashsend [11]
To achieve this, use in-app checklists triggered by user behavior. For instance, if someone hasn’t completed setup within 3 days, prompt them directly in the app rather than relying only on emails. Companies with feature adoption rates above 70% are twice as likely to retain their customers [12]. This makes activation one of the most impactful areas to optimize in your overall retention strategy.
Retention strategies hinge on having reliable, unified data. Without a clear view of user behavior, even the most thoughtfully designed segments can lead to misleading conclusions and wasted efforts.
SaaS companies often store behavioral data in disconnected silos. Product analytics are kept in one tool, billing details in another, and support tickets somewhere else entirely. To create effective segmentation, you need to bring these streams together: product events (like sessions and feature usage), support events (such as ticket volume and sentiment), and billing events (payment failures or plan changes) [14].
A Customer Data Platform (CDP) like Segment or mParticle can help by stitching together fragmented user sessions - anonymous site visits, work email signups, and multi-device logins - into a single, unified profile [15]. To ensure accuracy, establish a consistent naming system (e.g., Object_Action) before setting up event tracking. Using standardized formats like Feature_Activated or Plan_Upgraded across teams helps avoid errors that stem from mismatched conventions like page_view versus PageViewed [15].
Instead of overwhelming your team with dozens of segments, start with three or four high-impact ones, such as Power Users, At-Risk Users, and Onboarding Drop-offs [15]. Pair this unified data with predictive models to identify churn risks early.
Static user behavior snapshots no longer cut it. By the time a weekly report flags someone as “low risk,” they may have already disengaged.
"Churn is not an event - it's a process. By the time a user clicks 'Cancel Subscription,' they've already mentally left days or weeks ago." - RisingWave Labs [17]
Retention teams now track Engagement Velocity - the week-over-week change in usage - to predict churn [3]. For example, if a user’s session trend ratio drops below 0.5 (indicating usage has halved week-over-week), it’s a strong warning sign, even if overall usage still looks fine [17]. Similarly, when a user narrows their activity to just one workflow after previously engaging with multiple features, it often signals they’re about to leave [17].
Predictive models also improve prioritization. By categorizing users into Low, Medium, and High risk, teams can focus their efforts where it matters most: expensive, human-led outreach for high-value accounts and automated responses for lower-value ones [16]. However, don’t rely on a predictive score alone to trigger manual intervention. Require at least three supporting signals - like a notable behavioral shift, a history of support tickets, and prior CRM interactions - before escalating [16]. For maximum impact, set up intervention triggers 60 days ahead of subscription renewals, which can triple the success rate of retention efforts [13].
These predictive strategies directly tie into financial outcomes, as explained next.
Behavioral segmentation plays a direct role in improving financial metrics, particularly Net Revenue Retention (NRR). Calculated as (Starting MRR + Expansion MRR − Churn MRR) ÷ Starting MRR, NRR is a key indicator of financial stability and growth for SaaS companies [16]. A 10-point increase in NRR can raise a company’s valuation by 20–30%, making retention efforts one of the most impactful investments for growth-stage businesses [13].
It’s important to distinguish between logo churn and revenue churn. Losing a $29/month self-serve user and a $3,000/month enterprise account both count as one lost customer, but they require vastly different responses and have very different financial impacts [5]. Behavioral segmentation, combined with Average Revenue Per Account (ARPA) tiering, ensures your team focuses on efforts that deliver the highest financial returns.
In addition to voluntary churn, involuntary churn - such as failed payments - deserves attention. Payment failures account for 20–40% of cancellations, but with smart retry logic (an extension of behavioral monitoring), you can recover up to 70% of failed payments compared to just 30% with basic dunning [13].
"If your churn program produces more alerts but no measurable change in retained revenue, save rate, or gross margin, you are funding activity, not performance." - Gruv.ai [16]
Behavioral segmentation isn’t something you set and forget. User behavior changes, products grow, and what once flagged potential churn may no longer hold true. Think of segmentation as a living process, not a static report.
"If your segmentation work does not change what the product team builds... it is not real segmentation. It is a slide." - Atticus Li, Applied Experimentation Lead at NRG Energy [1]
To keep segments relevant, regularly assess how often users engage in the key actions that predict retention. This helps identify shifts - like someone moving from Power User to Casual or from Casual to Dormant - without needing to overhaul the entire framework. Just as important, eliminate any segments that no longer drive distinct actions. If two segments react the same way to product updates or experiments, merge or drop them. Keeping unnecessary complexity only adds to your workload.
For review frequency, aim for daily live queries on your data layer. At the very least, revisit them weekly for retention-focused insights [18]. Letting segments go stale creates blind spots, especially for identifying users at risk of disengagement.
Dynamic segmentation also forms the backbone of a strong governance framework, helping teams act on retention signals proactively instead of reacting too late.
Having accurate data and actionable segments is only part of the equation. A retention governance framework ensures your team has a structured approach to consistently tackle churn risks.
Start with key components: a unified data source, a trusted health score, behavioral trigger playbooks, and a formalized renewal process [19]. A strong health score should combine multiple factors, such as product usage depth, engagement frequency, customer support sentiment, and relationship indicators - like whether a key executive sponsor has left the company. Sponsor turnover is a major churn predictor and should trigger immediate outreach across multiple channels [19][20].
On the operational side, hold a 30-minute weekly account risk review to focus on red and yellow accounts. Assign clear action items to specific owners for each flagged account [19]. Renewal discussions should start 90 to 120 days before contract expiration, giving your team time to address competitive threats or internal challenges. Waiting until 30 days prior is often too late [19][20]. Additionally, track Time to First Value - the time it takes from contract signing to the first meaningful success milestone. Accounts that miss this milestone should be flagged as high-risk immediately [19].
"Retention dies in matrix organizations where everyone is responsible and no one is accountable." - Customermates [19]
To ensure accountability, assign one person ownership of Net Revenue Retention (NRR) as the primary retention metric. Without a clear owner, even the best frameworks can stall.
Phoenix Strategy Group brings a unique edge to SaaS retention by connecting user behavior to financial outcomes. Many growth-stage SaaS companies lack the in-house infrastructure to scale behavioral segmentation effectively, and that’s where Phoenix Strategy Group steps in.
They create a unified data foundation by integrating product, support, and commercial data [9][18]. Their FP&A and fractional CFO services go a step further, translating behavioral segments into board-level metrics like NRR, MRR churn, LTV, and CAC payback periods. This approach transforms retention programs from cost centers into growth drivers.
For scaling SaaS companies, tying retention metrics to financial models not only strengthens investor pitches but also boosts valuation.
Targeted retention strategies rooted in behavioral data paint a clear path forward. Shifting the focus from user demographics to their actions is the secret to reducing churn and fostering consistent growth.
Data shows the impact of mature behavioral monitoring: companies see 120%–140% NRR, while reactive models struggle to break 100% [2]. Real-world examples back this up. A healthcare SaaS platform with $22M in ARR cut churn by 23% within 90 days using RFM-based segmentation and reason-driven win-back campaigns [3]. Similarly, PocketSuite reduced churn by 30% by leveraging real-time engagement signals [2].
The approach is practical and actionable. Start by identifying the single most predictive action for long-term retention. Build three to five high-impact segments - like trial non-activators, at-risk users, and power users primed for expansion. Automate segment transitions and ensure all interventions are tied to measurable financial outcomes. Once the framework is in place, scaling becomes much easier.
Retention isn’t a one-and-done effort. Companies that adapt their segments as user behaviors evolve, monitor Engagement Velocity weekly, and link retention metrics to board-level goals can turn retention into a reliable growth driver. These strategies empower SaaS businesses to achieve measurable financial results and long-term success [3].
To segment users based on behavior, focus on tracking critical actions like how they engage with features, how often they log in, their progress during onboarding, and their overall usage habits. These data points give you a clearer picture of user interactions with your product and can uncover patterns that inform effective retention strategies.
Identifying when users experience your product's core value is all about understanding their behavior and usage patterns. By mapping out the customer journey, you can pinpoint the exact moment they achieve a meaningful outcome or benefit. This is often the turning point where users truly see the value in what you offer.
To do this, use behavioral segmentation to track these key moments. This approach allows you to group users based on their interactions and milestones within your product. Once you’ve identified these critical points, focus your onboarding and engagement efforts on reinforcing that realization.
Why does this matter? Defining this "aha" moment enables you to craft strategies that keep users coming back. It’s a powerful way to drive retention and ensure your audience stays engaged with your product over time.
To transform churn-risk segments into a boost for Net Revenue Retention (NRR), focus on targeted, proactive strategies that leverage data effectively. Start by identifying high-value accounts that show signs of risk. Frameworks like RFM analysis (Recency, Frequency, Monetary value) or usage matrices can help spotlight these accounts. Once identified, prioritize them for personalized outreach - tailored communication can make all the difference.
For lower-tier segments, automation is your ally. Implement in-app nudges or create multi-step cancellation flows to address potential churn without stretching resources. Additionally, predictive models can be a game-changer. By monitoring risk indicators like declining usage patterns or increased support requests, you can trigger real-time, context-aware campaigns to re-engage users before they churn.