Published on
July 11, 2026

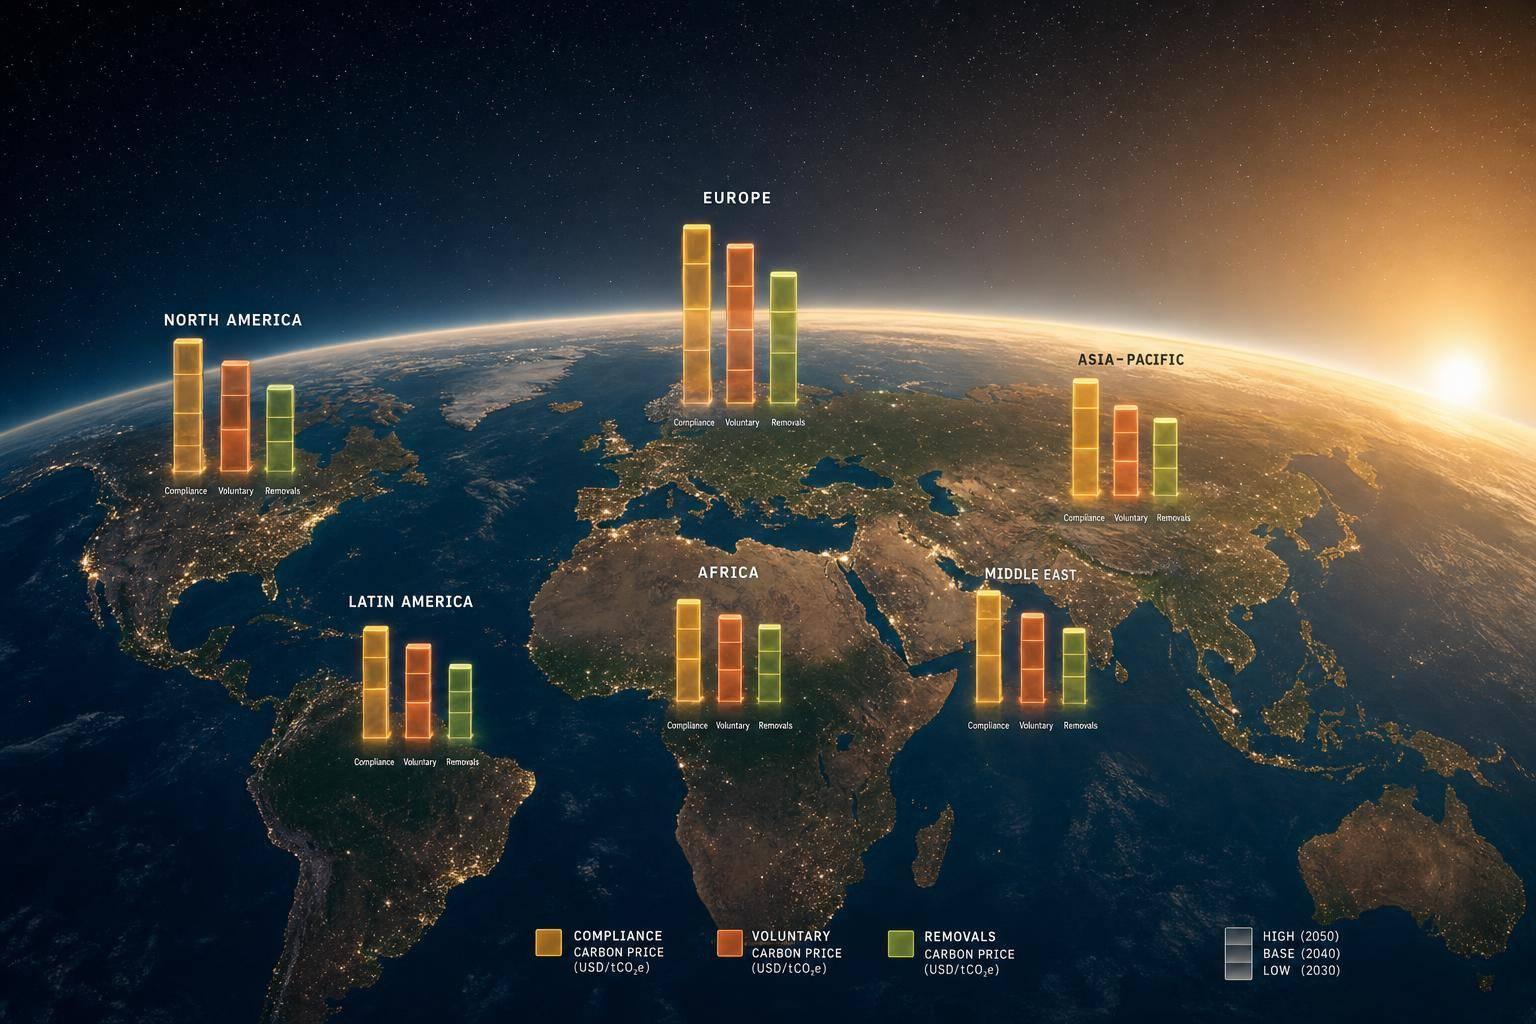
Carbon pricing is not one market. In this article, I’d frame the headline point like this: if I’m building a model today, I should expect carbon costs to range from about $13 per metric ton for lower-priced voluntary supply to as high as $254 per metric ton for removal-heavy cases, while compliance systems like the EU ETS, RGGI, California, China, and New Zealand each follow their own pricing logic.
Here’s the short version:
A few numbers stand out right away:

Carbon Credit Price Benchmarks by Market & Region (2025–2050)
| Market area | Main price signal | What I’d use it for | Key watchout |
|---|---|---|---|
| Compliance markets | Allowance spot, auction, and forward prices | Cost modeling for regulated emissions | Rules differ by region and sector |
| Voluntary avoidance credits | Lower-price benchmark bands | Low-case procurement assumptions | More pressure on quality and claims |
| Voluntary removals | Higher-price benchmark bands | Net-zero and stress-test cases | Prices can swing a lot over time |
| Engineered removals (DAC) | Long-term reference price | Ceiling for removal planning | Long-dated and still developing |
If I had to sum up the full piece in one line, it would be this: carbon benchmarks only work when I match the right market, right region, and right credit type to the model. The rest of the article explains how to do that without mixing unlike prices.
Compliance markets put a legal cap on emissions. That means the price tag is not just theoretical - it can hit a deal model hard. If a company guesses too low on allowance costs, margins can get squeezed after signing, even if the model looked fine on day one.
That’s why compliance markets are the best place to start. They give finance teams the strongest regional carbon cost signals available today. Use the table below as a working reference for the systems that show up most often in current models.
| Region / System | Market Type | Latest Reference Point (mid-2025) | Covered Sectors | Volatility Notes |
|---|---|---|---|---|
| EU ETS | Cap-and-trade | Soft; lagged natural gas by ~3% in mid-2025 | Power, industry, aviation | Sensitive to natural gas prices and free allocation phase-down [2] |
| EU ETS2 | Cap-and-trade (pending) | Not yet trading; treat as scenario input | Road transport, heating fuels | 20 EU member states faced legal action in 2025 for delayed implementation [2] |
| RGGI (US Northeast) | Cap-and-trade | Rose nearly 5% in mid-June 2025 [2] | Power sector only | Sensitive to seasonal weather forecasts and allowance supply [2] |
| Massachusetts GWSA | Compliance auction | Record highs for later-vintage auctions in June 2025 [2] | Power sector | State-level compliance cost benchmark [2] |
| New Zealand ETS | Cap-and-trade | NZ$60 per metric ton (~$36.36 USD) in June 2025 [2] | All sectors, including forestry | Land-use distortion has pushed forestry ahead of dairy in some areas [2] |
| China ETS | Compliance | Expanding sector coverage beyond power | Power, broadening over time | Offsets permitted within compliance [1] |
| California Cap-and-Trade | Cap-and-trade | Varies; domestic offsets accepted for partial compliance | Broad multi-sector | Offset acceptance rules affect the effective cost ceiling [1] |
| Canada Output-Based Pricing | Hybrid pricing system | Varies by province | Broad multi-sector | Domestic offsets can meet part of compliance obligation [1] |
For Europe-facing models, EUA prices are usually the first number teams plug in. EU Allowances (EUAs) remain the most cited compliance benchmark in the world, even though prices were soft in mid-2025 and lagged natural gas by nearly 3% [2].
ETS2 adds another layer of uncertainty. It covers road transport and heating fuels, but it was not yet trading by mid-2025. On top of that, 20 EU member states faced legal action in 2025 for delayed implementation [2]. In plain English: don’t treat ETS2 like a clean single forecast. It fits better as a scenario input than as a fixed point estimate.
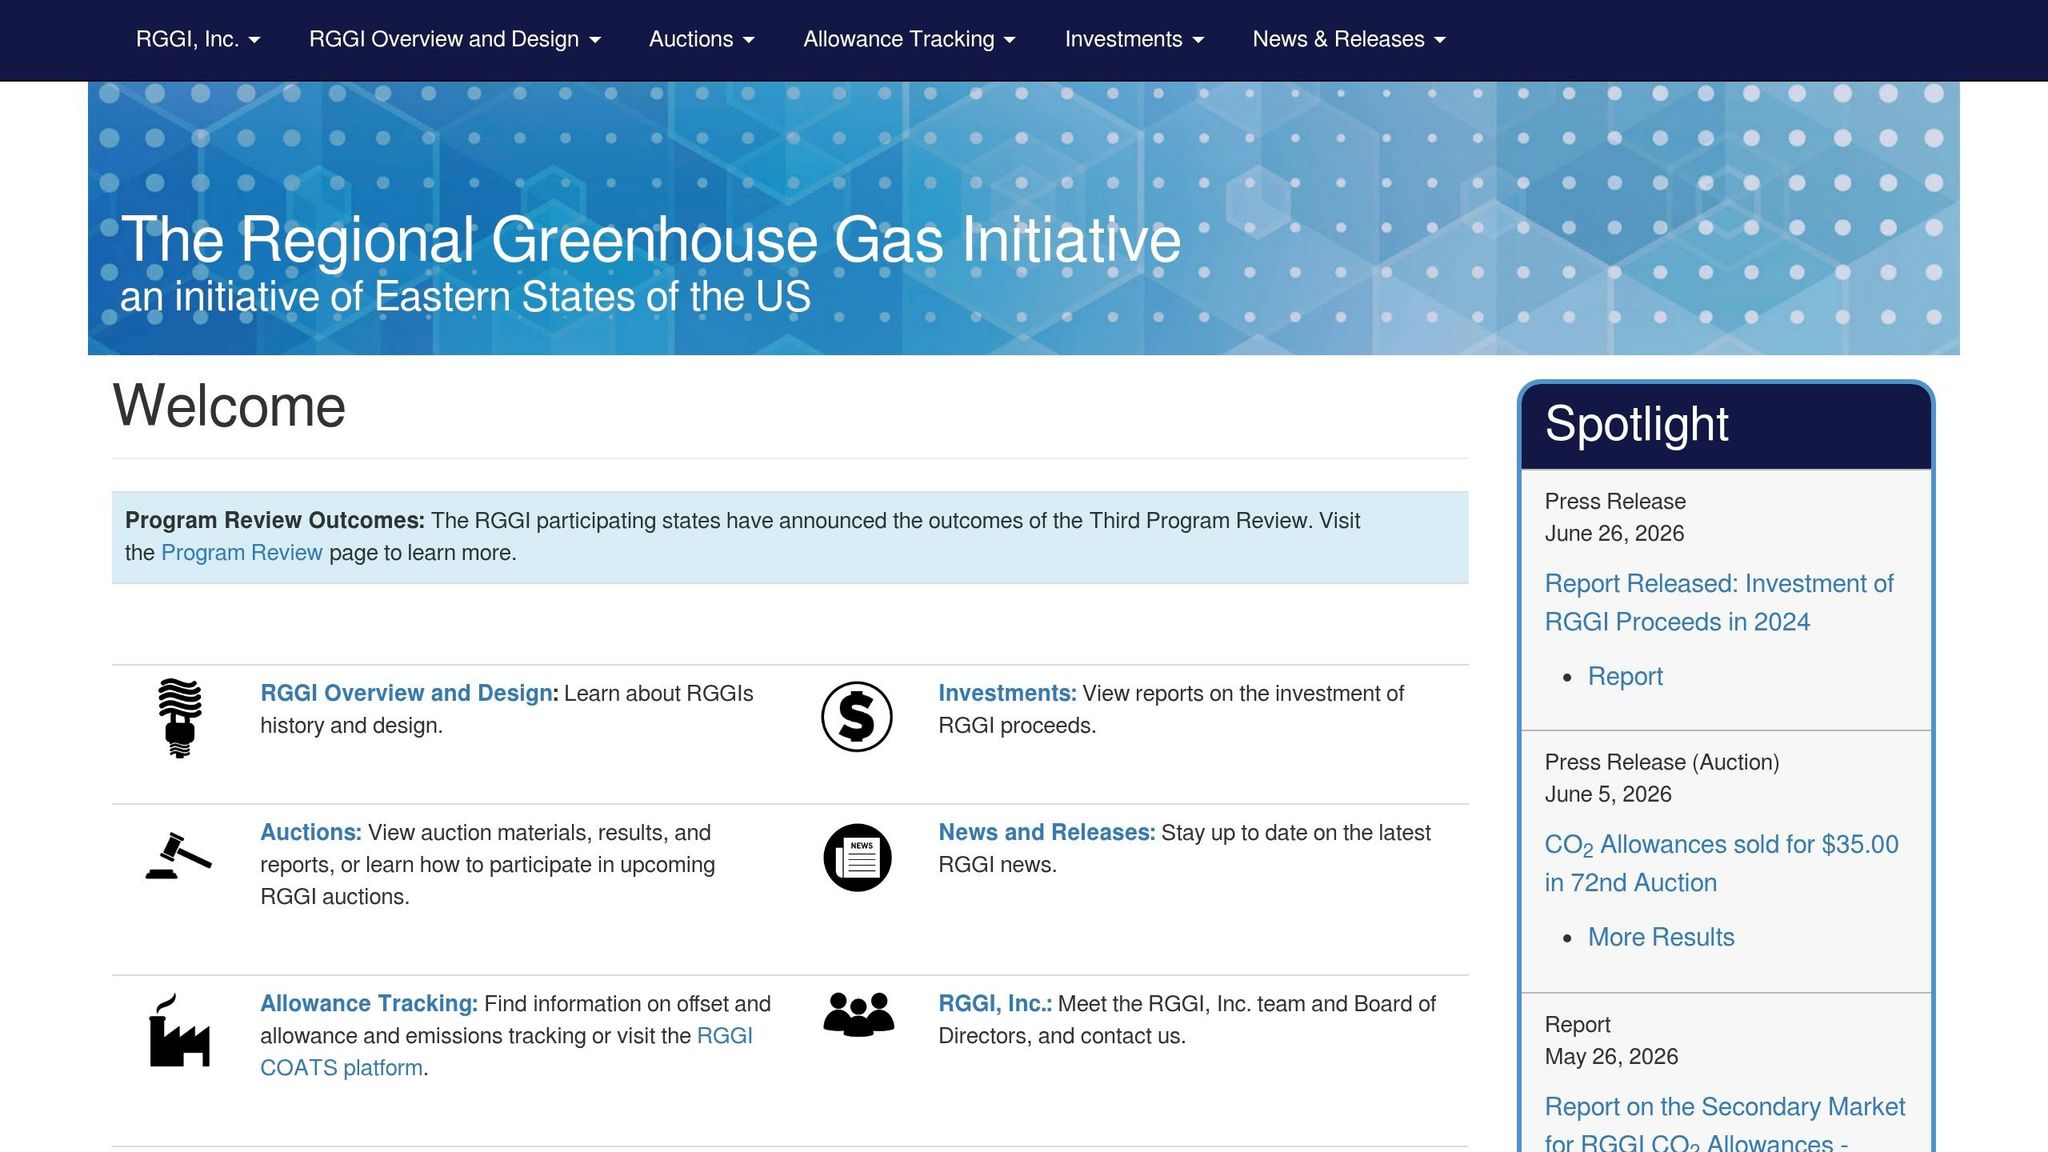
In the Northeast, RGGI is the main U.S. compliance benchmark for electricity cost modeling. Prices rose nearly 5% in mid-June 2025, with summer weather forecasts and tight allowance supply helping drive the move [2].
Massachusetts GWSA auctions add another useful signal. Later-vintage auctions hit record highs in June 2025 [2], which gives teams a sharp state-level marker for local compliance cost pressure.
California and Canada work a bit differently. Both let companies use domestic offsets to meet part of their compliance burden [1]. That matters because offset rules can act like a practical ceiling in a deal model. If part of the obligation can be covered with offsets, the all-in compliance cost may not track allowance prices one-for-one.
New Zealand’s ETS priced at about NZ$60 per metric ton in June 2025, or roughly $36.36 USD [2]. One side effect has been land-use distortion, with forestry moving ahead of dairy farming in some parts of the country [2]. That’s not just a market footnote - it shows how carbon pricing can shape business choices on the ground.
China’s ETS is also worth watching. It is expanding beyond the power sector, and offsets are allowed within the compliance system [1]. For companies with Chinese supply chain exposure, that changes how carbon costs should be modeled, especially as sector coverage broadens over time.
These regulated benchmarks set the floor for carbon pricing. Voluntary credits are a different story, with much more variation by project type and registry quality.
Voluntary carbon credit prices change a lot by project type, region, and quality. Two 1 tCO₂e credits may look the same on paper, but they can trade at very different prices when verification, durability, or co-benefits are not equal.
Right now, the market is drifting into two camps: higher-integrity credits and lower-quality supply [1]. And the spread between them is getting larger. Why? Because many corporate buyers are moving away from buying offsets for image reasons and toward buying them to neutralize residual emissions tied to net-zero targets. That kind of buyer is usually less sensitive to price. Regional benchmarks also get tighter where voluntary supply overlaps with compliance demand, including California, Canada, Australia, and China [1].
| Project Type / Tier | Benchmark Band (USD/metric ton) | Meaning |
|---|---|---|
| Mixed-quality voluntary market | $13 in 2030; $35 in 2050 [1] | Useful low-band reference for mixed-quality supply |
| High-quality credits | Up to about $38 by 2038 [1] | Premium tier driven by integrity and additionality |
| Avoidance credits (REDD+, clean energy, cookstoves) | About $22 by 2050 in the mixed-quality market case; roughly $32 by 2050 in an avoidance-only scenario [1] | Lower end of the market and under increasing scrutiny |
| Removal credits (reforestation, afforestation, agriculture, mangroves) | About $42 in 2030, peaking near $254 in 2037 [1] | Higher-price band for net-zero-aligned portfolios |
| Engineered removals (DAC) | About $88 by 2050 [1] | Long-term marginal price setter |
Use these bands as reference points by project type. Regional pricing still moves with governance, regulation, and buyer demand.
Nature-based credits cover the broadest geographic spread in the voluntary market, and origin matters more than many buyers assume. A REDD+ credit from Peru or Kenya may carry the same registry label, yet still trade at a different price because of durability risk, local governance, and co-benefit verification.
That has become harder to ignore. Scrutiny of major projects in Peru, Indonesia, and Kenya cut REDD+ supply in 2022 [1]. So even within the same project class, pricing can swing based on where the credit comes from and how strong the underlying claims are.
Afforestation and reforestation credits usually trade above pure avoidance credits because they are positioned as removals. That lines up better with Science Based Targets initiative (SBTi) expectations for long-term net-zero claims [1]. Mangrove and blue carbon credits are still early-stage, but buyers are paying more attention to them for removal-focused portfolios.
In Latin America and Africa, co-benefits like biodiversity and community support can help support a premium. Still, buyers are leaning more on third-party ratings to check whether those claims hold up [1].
Avoidance and removal credits sit on opposite ends of the price stack.
Renewable energy credits and other avoidance-based credits tend to sit at the low end of the voluntary market. They also face more pressure as buyers pull back from using avoidance offsets for net-zero claims [1]. That shift matters for pricing. A credit tied to avoided emissions may still have demand, but it won't usually command the same price as a removal credit aimed at long-term climate claims.
Carbon removals are in a much higher price band. In removal scenarios, prices can hit $42 per metric ton in 2030 and peak at $254 per metric ton in 2037. DAC, meanwhile, is expected to move down toward about $88 per metric ton by 2050 [1].
A registry name by itself no longer decides price. Independent ratings from BeZero and Sylvera, along with the Integrity Council for the Voluntary Carbon Market's Core Carbon Principles, are becoming central to price discovery [1]. Verra has also warned that much of current supply may not meet emerging CCP standards [1].
For deal models and FP&A, that changes how benchmarks should be used. It is not enough to tag a credit as forestry, DAC, or cookstoves and stop there. Benchmark selection should reflect:
Quality tiers shift credits up or down within the benchmark band. They do not replace the band itself.
Regional carbon prices start to matter when you turn them into model inputs. In practice, that means choosing the right scenario, pairing it with the right geography, and keeping compliance costs separate from voluntary offset buying.
Once you have the benchmark bands, the next job is to turn them into forecast assumptions. Build three cases from those bands above. Use the low band for your low case, the premium-quality base case for your base case, and the removal scenario for your high case or stress test. [1]
For SBTi net-zero planning, long-term procurement should be tied to removal benchmarks. Avoidance credits do not cover final neutralization. [1] Geography matters too. California and Canada allow some offsets in compliance markets, which can push local prices higher. [1] That belongs in regional OpEx assumptions, not in one generic global carbon cost line. Small modeling choice, big difference. It flows through forecast carbon cost and ends up affecting enterprise value.
These benchmarks have a clear place in DCF work, budgeting, capital allocation, and diligence.
| Use Case | Benchmark Used | Modeling Method | Financial Impact |
|---|---|---|---|
| DCF Valuation | Long-term removal scenarios | Forecasted carbon price curves integrated into terminal value | FCF, enterprise value |
| Fractional CFO budgeting | Regional spot and forward prices | Annual OpEx line for offset procurement based on gross emissions | EBITDA, operating margin |
| Capital Allocation | Marginal abatement cost vs. DAC benchmarks | IRR comparison for decarbonization CapEx | CapEx efficiency, ROIC |
| M&A Diligence | Premium-quality credits | Sensitivity analysis on hard-to-abate emission liabilities | Adjusted EBITDA, valuation multiples |
In M&A, the quality tier of a target’s current offset portfolio can’t be brushed aside. If that portfolio leans on lower-quality avoidance credits, you’re looking at reputational risk and repricing risk. Both should feed into adjusted EBITDA. Third-party ratings from BeZero or Sylvera give you a solid basis for making that adjustment. [1]
Now that the regional benchmarks are in place, the next step is to turn them into forecast ranges by credit type.
Planning ranges by credit type
| Market / Credit Type | 2030 Price ($/metric ton) | Peak / Reference Price ($/metric ton) | 2050 Price ($/metric ton) | Main Drivers | Modeling Implication |
|---|---|---|---|---|---|
| Voluntary market | $13 [1] | - | $35 [1] | Status quo demand | Use as the lower bound for routine procurement planning |
| Quality split: high-quality credits | - | $38 in 2038 [1] | - | ICVCM Core Carbon Principles, rating agency premiums | Use as the premium case for high-integrity portfolios |
| Quality split: low-quality credits | - | - | $22 [1] | Supply pressure, liquidity risk | Use as the downside case for weaker credits |
| Removal only | $42 [1] | $254 in 2037 [1] | $88 [1] | DAC marginal cost, long-term demand | Use DAC as the long-term ceiling for removal planning |
These bands give fractional CFOs and finance teams a practical way to connect regional exposure to procurement plans, margin assumptions, and valuation work.
The spread between high- and low-integrity credits is no longer just something to note in market commentary. It now belongs in the model. Policy-led demand can squeeze supply and push up floor prices, especially when compliance and voluntary buyers are going after the same credits. [1]
For removal planning, DAC acts as the long-term ceiling. Prices move toward about $88 per metric ton by 2050 as scale improves. [1]
That scenario spread is what you use to pressure-test EBITDA, enterprise value, and capital allocation across each price band.
Use region- and market-specific benchmarks. Keep compliance and voluntary prices separate. That makes it easier to see where policy-led floor signals could shift your cost base. [1]
Match price to project quality. A REDD+ avoidance credit is not the same thing as a DAC removal credit. Credits aligned with ICVCM Core Carbon Principles or rated well by firms like BeZero or Sylvera should carry a premium in the model. [1]
Build regional carbon assumptions into forecasting and diligence models as low, base, and high cases.
The carbon credit market is highly fragmented. It is not one unified market.
Different regions use different rules, methodologies, and regulatory frameworks. So there isn’t a single global price.
Prices also change based on local regulation, political stability, and project-level risk. That includes delivery risk, permanence risk, and vintage. And because credits often aren’t interchangeable across borders, one universal benchmark doesn’t work for valuation or deal modeling.
Separate them by market purpose because each market plays by a different set of rules and has its own price drivers.
Compliance credits are linked to mandates like CORSIA or cap-and-trade systems. That means buyers often have to meet specific rules around vintage, quality, and eligibility.
Voluntary credits work differently. Their prices tend to lean more on project ratings, additionality, and a track record of verified delivery.
Use compliance benchmarks for regulatory use, and use voluntary indices for non-mandated offsets. If a compliance market allows some voluntary offsets, model that jurisdiction’s eligibility rules on their own.
Choose removals over avoidance credits when you need stronger long-term durability and a closer fit with net-zero pathways that rely on permanent carbon storage.
Avoidance credits can help prevent emissions. But they often come with extra questions around additionality and baselines. Removals usually cost more and are harder to execute, yet they offer a clearer climate outcome and may give you better protection against future regulatory scrutiny and shifts in carbon accounting standards.