Published on
July 11, 2026


If I want benchmarking to help me make better calls, I need three things: the right KPIs, the right peer group, and a fixed review rhythm. That is the whole system.
Here’s the short version:
The article’s main point is simple: benchmarking is not about making prettier board slides. It is about making faster, clearer decisions.
A few numbers from the piece make that plain:
What I like about this framework is that it keeps the process tight:
It also makes one point that founders often miss: internal trends and external benchmarks do different jobs. Internal data tells me whether I am improving. External data tells me whether I am improving fast enough.
The article also keeps sector differences clear. A SaaS dashboard should not look like a home services dashboard. And a healthcare business should not be judged with only SaaS-style metrics. Metrics have to fit how the company earns money and where it tends to break.
In short, this guide lays out a clean way to run benchmarking across SaaS, healthcare, legal tech, and home services, with examples in the $1 million to $10 million ARR range. If I use it well, I get a repeatable system for monthly reviews, quarterly board meetings, and day-to-day decisions.
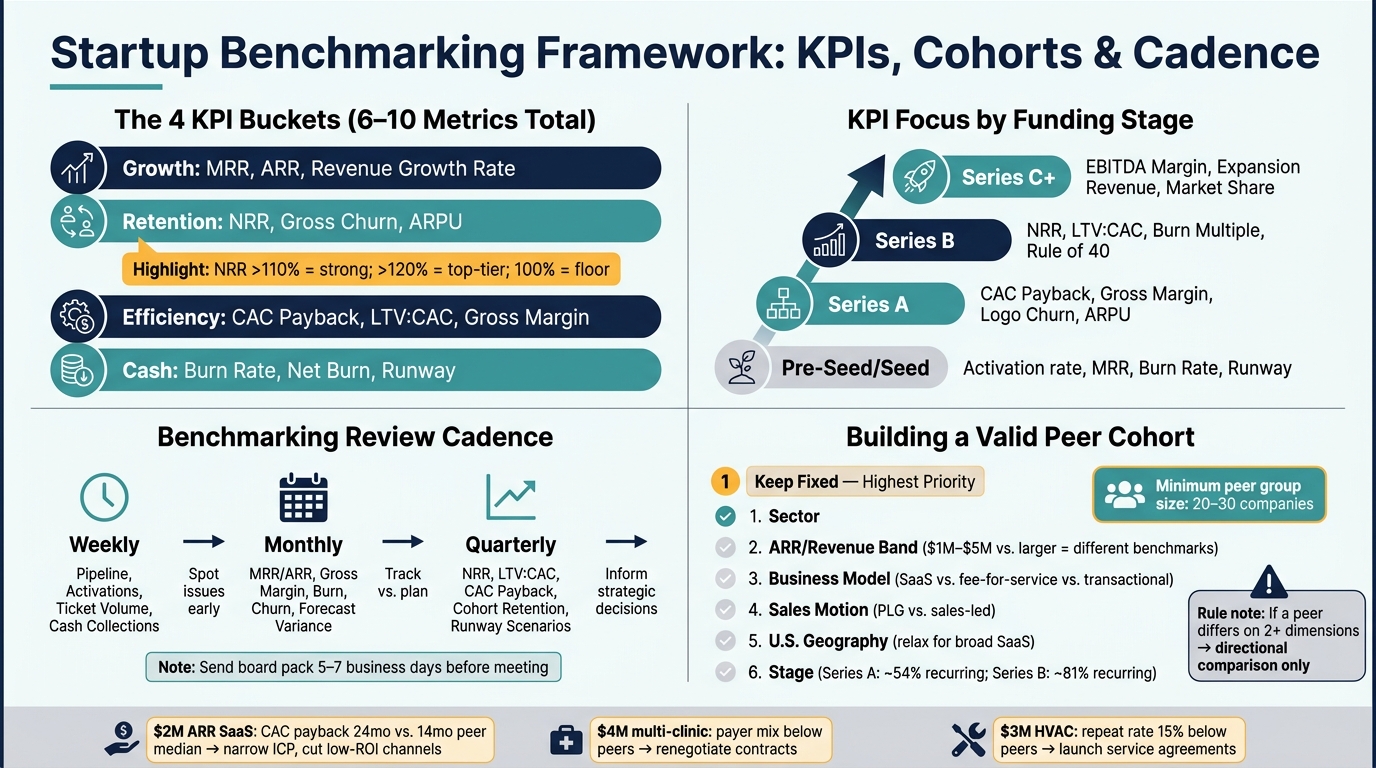
Startup KPI Benchmarking Framework: Metrics by Stage & Sector
Pick one main KPI for each core bucket - growth, retention, efficiency, and cash. Then add only the extra metrics needed to explain why that number moved. In practice, most strong dashboards land at 6–10 metrics. That’s enough to show what matters without turning the dashboard into a junk drawer.
The next step is simple: build a small KPI stack from those four buckets, then match each metric to how the business actually makes money.
Benchmarking only works when the metrics match the business model. If the inputs are off, the comparison is off too. These four buckets are a solid base for a board-ready KPI set.
| Category | Key Metrics | What It Measures | Best Fit |
|---|---|---|---|
| Growth | MRR, ARR, revenue growth rate | Scale and top-line momentum | SaaS, Legal Tech, Healthcare (SaaS models), Home Services |
| Retention | Gross churn, NRR, customer retention rate, ARPU/ASP | Product stickiness and expansion revenue | SaaS, Legal Tech, B2B Healthcare |
| Efficiency | CAC, CAC payback, LTV, LTV:CAC, gross margin | Whether growth is economically sustainable | All sectors; especially Home Services and Healthcare |
| Cash | Burn rate, net burn, runway | Survival and fundraising urgency | All sectors, especially Seed through Series B |
After that, shape the stack around the economics that drive your sector.
Labor-heavy businesses like home services often need metrics such as gross margin per job and cash collection speed. Healthcare usually needs a different lens: patient acquisition cost, visit volume, payer mix, reimbursement lag, denial rate, and gross margin by service line. In healthcare, a SaaS-style view leaves out too much of how the business runs day to day.
The goal is to choose metrics that surface the business model’s biggest risk - or its strongest profit driver.
A Seed company and a Series B company should not run the same KPI playbook. Early-stage teams are trying to prove traction and repeatability. Later-stage teams get judged more on retention quality, margin staying power, and capital efficiency.
| Stage | Primary Focus | Priority KPIs |
|---|---|---|
| Pre-Seed / Seed | Product-market fit and early traction | Activation rate, pipeline velocity, MRR, burn rate, runway |
| Series A | Repeatable unit economics | CAC payback, gross margin, logo churn, ARPU/ASP |
| Series B | Efficient, scalable growth | NRR, LTV:CAC, burn multiple, Rule of 40 |
| Series C+ | Profitability and exit readiness | EBITDA margin, expansion revenue, market share |
At Seed, a founder may care more about demo-to-close conversion or first-dollar revenue than about a polished CAC payback ratio. That makes sense. The company is still proving people want the product.
By Series B, the standard changes. Investors want proof that growth can continue without chewing through cash in an inefficient way.
Each sector needs a KPI set that fits its revenue engine and operating risks.
SaaS companies usually build their dashboards around MRR/ARR, churn, NRR, CAC payback, and gross margin. High-performing SaaS companies often target NRR above 110%[1][2].
Healthcare businesses need a different mix: patient acquisition cost, visit volume, payer mix, reimbursement lag, denial rate, and gross margin by service line. In early-stage healthcare, regulatory milestones can also work as proxy KPIs for revenue progress.
Legal tech companies often track matter volume, lead-to-signed-client conversion, realization rate, billable utilization, average case value, and collection cycle. Because legal tech tends to be sticky, low churn is usually expected. That shifts attention to expansion ARR as the main growth driver to watch.
Home services businesses focus on booked jobs, show-up rate, completion rate, average ticket size, gross margin per job, repeat booking rate, and cash conversion speed. This is a very different setup from SaaS. Gross margin here can swing hard based on labor costs and technician productivity, especially billable hours versus drive time.
A simple way to manage the rhythm:
Once the KPI set is fixed, compare it only against peers using the same definitions and the same business model.
Once your KPI definitions are locked, the next job is picking peers that make the numbers comparable. A peer cohort only helps when the companies in it are actually like-for-like. If the cohort is off, the takeaway will be off too. And that leads to bad calls, which is why many startups hire a fractional CFO to ensure data integrity.
When you build a peer group, four dimensions do most of the heavy lifting: sector, ARR or revenue band, business model, and U.S. geography. Match on all four when you can. If the peer set gets too thin - fewer than 20 to 30 companies - relax geography or sales motion first. Keep sector and ARR band fixed.[3][4]
| Cohort Dimension | Why It Matters | When to Exclude or Relax |
|---|---|---|
| Sector | Growth rates, margin structures, and retention norms differ a lot across industries, such as SaaS vs. fee-for-service healthcare. | Rarely - sector is usually the first filter to keep fixed. |
| ARR / Revenue Band | Growth expectations and efficiency benchmarks shift hard by scale, so a company in the $1M–$5M range should not be judged against a much larger company. | Only relax if the peer pool is too small to be useful. |
| Business Model | Subscription SaaS, transactional marketplaces, fee-for-service healthcare, hourly-billed legal tech services, and home services lead-gen platforms all have different NRR, CAC, and margin profiles. | Relax for directional checks only; annotate the comparison. |
| U.S. Geography | Cost structures, wage levels, demand, and investor expectations can differ by region. | Relax for broad SaaS benchmarks where regional differences are smaller. |
| Sales Motion | PLG and sales-led models produce very different CAC payback and ACV profiles; mixing them distorts sales efficiency benchmarks. | Relax for early-stage pattern recognition when peer data is limited. |
| Stage | A Series B digital health company has 81% of revenue recurring on average, versus 54% for Series A.[5] | Relax only when building aspirational targets, and annotate the comparison. |
One simple rule helps here: if a peer differs on more than one dimension, treat the comparison as directional only.
Use that same logic inside your own business. Group customers or operations into like-for-like buckets. External benchmarks show how you stack up against the market. Internal cohorts show where things inside the business are working - and where they’re starting to crack.
Start with acquisition month or quarter, then track retention, revenue, and churn over time. That gives you a clean read on whether a product change or a new onboarding flow helped the cohorts that came after it. From there, the best cuts depend a lot on the sector.
| Sector | Cohort Type | What It Reveals | Key Limitation |
|---|---|---|---|
| SaaS | Acquisition month, plan/tier, acquisition channel | Which channels and tiers drive the highest NRR and LTV | Requires consistent ARR definitions across cohorts |
| Healthcare | Payer type (commercial vs. Medicare/Medicaid), care program, clinic/location | Margin and claims-related churn by payer; which programs sustain engagement | Payer mix data can be slow to update; reimbursement lags distort timing |
| Legal Tech | Firm size (solo, small, mid-market), practice area, deployment type | Where product fit and seat expansion are strongest | Small firm cohorts may have high churn that skews averages |
| Home Services | Service type (HVAC, plumbing, landscaping), U.S. market/city, lead source | Seasonality, repeat booking patterns, and which lead sources deliver profitable customers | Seasonality can make short-window cohorts misleading |
Each cohort should answer one decision question: which channel, segment, or location deserves more investment?
After cohorts are set, review them on a fixed weekly, monthly, and quarterly cadence.
Once KPIs and cohorts are set, cadence determines when a metric should lead to action. That's what makes cadence the operating layer for the KPI stack and peer groups defined above.
Review leading indicators every week. That includes pipeline created, conversion, ticket volume, churn flags, and cash collections. When a metric moves outside its expected band, the owner should log a short note and the next step. Then review financial results each month: MRR/ARR, gross margin, burn, cash, and forecast variance. On a quarterly basis, review durability metrics like NRR, cohort retention, CAC payback, LTV by segment, and runway scenarios. Peer benchmarks should also be refreshed quarterly because new data tends to arrive with a lag.[6][7]
| Review Frequency | Metric Type | Examples | Primary Use |
|---|---|---|---|
| Weekly | Operational, leading indicators | Pipeline, activations, ticket volume, utilization, cash collections | Spot issues before they hit financials |
| Monthly | Financial performance, unit economics | MRR/ARR, gross margin, burn, churn, forecast variance | Track progress against plan |
| Quarterly | Strategic, durability metrics | NRR, LTV:CAC, CAC payback, cohort retention, runway scenarios | Inform hiring, pricing, and GTM decisions |
One threshold is worth spelling out in plain terms: if forecasted runway drops below a board-approved floor, a hiring freeze or spend review should kick in right away. Don't wait for the next quarterly meeting.[6]
That same cadence should feed straight into a board-ready package.
A board package should answer three simple questions in 20 pages or less: Are we on track? What risks need attention? What decisions need approval? Put the backup detail in the appendices. Across stages, five sections tend to hold up well: a KPI dashboard, cohort trends, benchmark comparisons, cash and runway, and a risks-and-decisions page. In each section, show the current period, the prior period, the budget or forecast, and a short note on any variance. Most boards care more about what's ahead than a long look in the rearview mirror, so rolling forecasts, scenario-based runway, and sensitivity analyses usually matter more than historical summaries alone.[9]
| Board Package Section | KPIs to Include | Why It Matters |
|---|---|---|
| KPI Dashboard | Revenue, ARR/MRR, gross margin, burn, liquidity | Shows whether the business is performing against plan |
| Cohort Trends | Retention curves, churn, expansion, LTV by segment | Reveals whether growth quality is improving or eroding |
| Benchmark Comparisons | Growth rate, CAC payback, gross margin, burn multiple, NRR | Puts performance in market context |
| Cash & Runway | Cash balance, monthly net burn, base and downside runway | Anchors hiring, pricing, and spend decisions |
| Risks & Decisions | Weakening retention, rising CAC, slower collections, forecast misses | Keeps the board focused on governance, not raw data |
Send the board pack 5–7 business days before the meeting and keep the same section order each quarter.[8] Consistency matters more than polish. Directors move through the deck faster when they already know where everything lives.
The hard part, of course, is putting this package together again and again when the data is scattered across systems.

Phoenix Strategy Group helps growth-stage companies build the data, FP&A, and board reporting systems needed for a reliable cadence.
Once your KPI stack and cohort structure are in place, the next step is simple: turn the gap into a decision.
That part stays the same across sectors. What changes is which KPIs matter most and what action each gap should push you toward.
For growth-stage companies, these are usually the KPIs that matter most and what a gap tends to mean in practice.
| Sector | Most Critical Growth-Stage KPIs | What a Gap Signals |
|---|---|---|
| SaaS | ARR growth rate, NRR, CAC payback, gross margin %, burn multiple | Churn or down-sell problem; tighten ICP, revise pricing, or cut low-ROI acquisition channels |
| Healthcare | Patient acquisition cost, patient retention rate, visit volume per provider, payer mix, contribution margin per provider | Scheduling or payer contract issue; renegotiate contracts, improve care coordination, or improve front-office workflows |
| Legal Tech | Seat utilization, workflow adoption rate, ARR per firm, expansion revenue, NPS | Weak product adoption; redesign onboarding, launch targeted adoption sprints with internal champions, or improve UX |
| Home Services | Job volume growth, repeat job rate, average revenue per job, technician utilization, gross margin per job | Operational or loyalty gap; introduce service agreements, optimize routes, or train technicians on upsell |
The table tells you what to watch. The next step is knowing how to respond.
For SaaS and recurring-revenue Legal Tech, Bessemer’s benchmarks treat 100% NRR as a useful floor, 110% as better, and 120%+ as best[10]. If NRR falls below 100%, that usually points to churn or down-sell. In plain English: fix retention before you pour more money into acquisition.
For digital health platforms, a 90-day patient retention rate above 35% is strong, while below 25% points to product experience issues that should be addressed before scaling acquisition[11]. In Home Services, repeat job rate and technician utilization often give the fastest read on margin and cash flow. Those numbers can tell you pretty fast whether the business is running smoothly or leaking money in small ways that add up.
A few examples make this clearer:
That’s the whole idea. A benchmark only matters if it changes what the team does next.
The point is not better reporting for its own sake. The point is faster action on pricing, hiring, operations, and capital.
The loop is simple: define KPIs, compare like-for-like cohorts, review on a fixed cadence, and turn each gap into one operating decision. Keep definitions fixed long enough to show trend lines. Keep board packages in the same format each quarter. Refresh peer cohorts when the business moves into a new revenue band or enters a new market.
When those habits are in place, benchmark outputs stop being slides for board meetings. They become the basis for decisions about hiring, pricing, and capital deployment.
Prioritize companies that line up with your business model, target audience, growth path, and revenue size. In most cases, 5 to 10 comparable companies is enough to make the analysis useful without watering down the data.
You can use classification systems like GICS or NAICS to find peers that operate under similar regulatory and competitive conditions. For a cleaner comparison, aim for companies with revenue within about 20% of your own and market cap within 30%. When possible, lean toward U.S. companies to keep reporting standards and market context more aligned.
The right KPIs change with your stage and your industry.
If you're below $1 million ARR, the main job is finding product-market fit. That usually means watching month-over-month MRR growth and retention cohorts closely. You want to see if people are signing up, sticking around, and coming back month after month.
From $1 million to $5 million ARR, the focus starts to shift. Growth still matters, but now the math behind that growth matters too. This is where unit economics come in, especially CAC payback and LTV:CAC.
At $10 million to $50 million ARR, companies usually need to balance growth with efficiency. In this range, teams often track Rule of 40, NRR, and Burn Multiple to see whether growth is healthy or too expensive.
Once you're above $50 million ARR, the focus moves more toward steady expansion. At that point, it's smart to watch NRR very closely and work to reduce logo churn.
Set your review cadence based on the metric itself.
Review core operational and financial metrics like runway, cash balance, and revenue trends monthly. These numbers can shift fast, so a monthly check helps you spot changes before they turn into bigger problems.
Update more complex unit economics, such as LTV, quarterly using cohort analysis. That gives you enough time to gather cleaner data and see patterns that a monthly snapshot might miss.
As your business matures, revisit benchmarks on a regular basis so they match current performance instead of old targets that no longer fit.