Published on
July 1, 2026


If I had to boil this down to one point, it’s this: I need five numbers to judge cash risk fast - gross burn, net burn, runway, burn multiple, and monthly cash change. Together, they show how much cash is going out, how much the company is losing each month, and how long the money lasts.
Here’s the short version:
A few numbers stand out. Fundraising often takes 3–6 months, so many teams start when they still have 9–12 months of runway. If runway drops below 6 months, pressure goes up fast. And after a fundraise in 2026, many companies want about 18–24 months of runway.
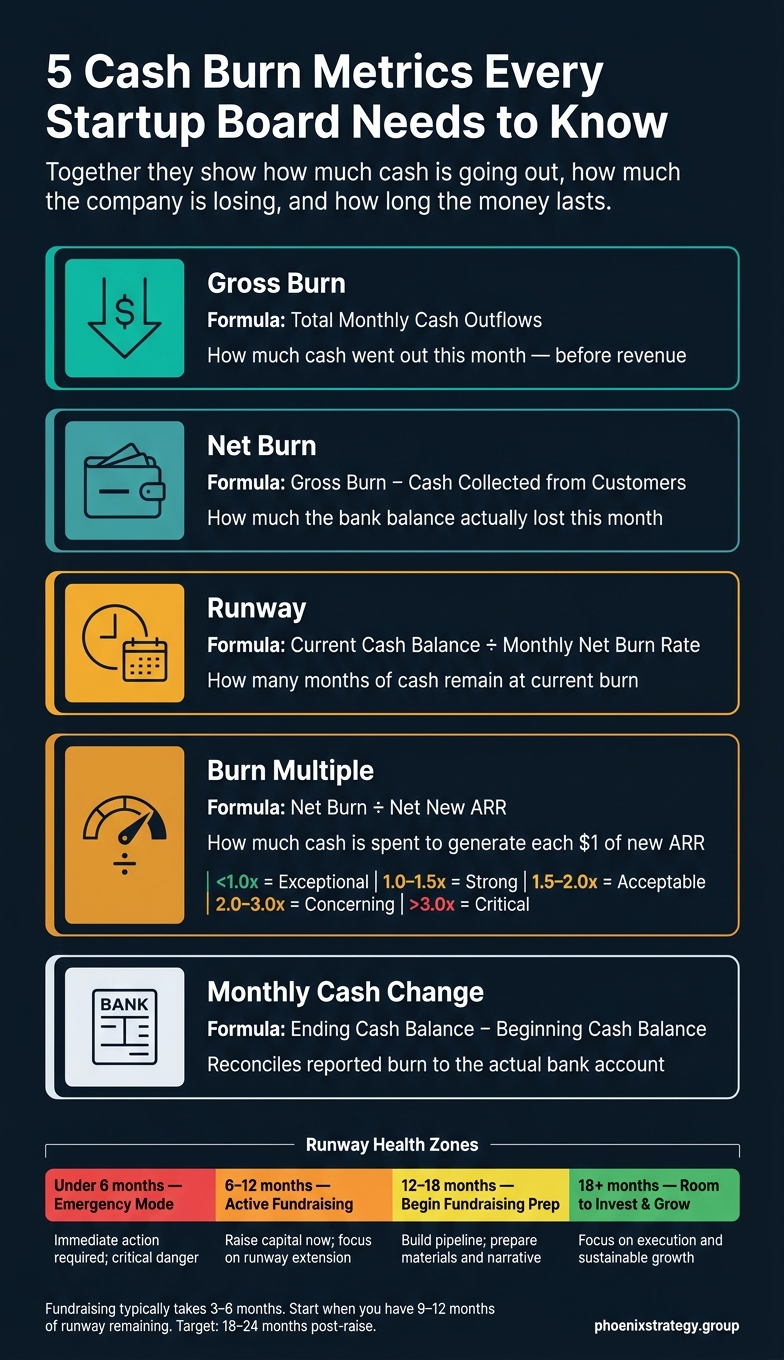
5 Cash Burn Metrics Every Startup Board Needs to Know
| Metric | What it answers | Main input |
|---|---|---|
| Gross Burn | How much cash went out? | Cash outflows |
| Net Burn | How much cash did the business lose? | Gross burn and customer cash collected |
| Runway | How long will cash last? | Cash balance and net burn |
| Burn Multiple | How much cash is spent to add ARR? | Net burn and net new ARR |
| Monthly Cash Change | What changed in the bank account? | Beginning and ending cash |
What I like about this setup is that each metric does a different job. One tracks spending, one tracks loss, one tracks time, one tracks growth efficiency, and one checks whether the story matches the bank account.
Gross burn is your total monthly cash outflow before revenue enters the picture. It gives you the starting point for net burn and runway.
Formula: Gross Burn = Monthly Cash Operating Outflows [1][3]
That number covers day-to-day cash costs like payroll and benefits, rent, marketing spend, and SaaS subscriptions. It does not include non-cash items like depreciation and stock-based compensation, because those don’t move money out of the bank account. Gross burn should be calculated on a cash basis, not an accrual basis, since accrual figures can hide when dollars actually leave the business [3].
You can pull gross burn from the general ledger, bank feeds, and cash flow statement [3][6].
For boards, gross burn works as a budget discipline tool. It removes revenue performance from the picture and shows whether the cost structure can stand on its own. For lenders, it acts as a risk signal, because a high burn rate compared with cash reserves shrinks the time available to hit the next milestone or secure bridge financing [1][9].
Net burn subtracts monthly revenue from this baseline.
Net burn is your monthly cash loss after customer money comes in. Gross burn tells you how much cash went out. Net burn shows what your bank balance actually lost during the month.
Formula: Net Burn = Gross Burn − Cash Collected from Customers [4][1]
The simplest way to calculate it is to take gross burn and subtract customer collections. You can also work it out from beginning cash minus ending cash, as long as you leave out financing inflows like equity raises or debt draws. If cash came in from investors or a loan, that’s not operating relief. It’s funding. Use cash flow or bank data for this, because your P&L and accrual revenue won’t show the month’s true cash loss [2][10].
For board reporting, net burn is often shown as a 3-month trailing average. That helps smooth one-off spikes like annual software renewals or legal fees [5][2]. Without that smoothing, one noisy month can make the business look worse than it is.
For lenders, net burn works like a countdown clock. It helps them judge liquidity risk and see how fast cash is leaving the business.
That monthly cash loss is the input for runway. Net burn feeds directly into runway.
Runway turns net burn into time. It tells you how many months your cash will last at the current net burn rate.
Formula: Runway = Current Cash Balance ÷ Monthly Net Burn Rate [3][7]
Use ending cash and operating net burn from the cash flow statement. Leave out financing inflows.
This number becomes most useful when you use it to time fundraising and spending decisions. Boards often use runway to set a fundraising trigger date, with seed-stage targets usually landing at 24–36 months [8].
A single runway number is only part of the picture. Boards should watch base, downside, and extension cases. Static runway gives you a quick pulse check, while dynamic runway layers in planned headcount and revenue changes to help guide decisions.
Runway also needs a lender lens, because debt changes the monthly cash picture. From a lender’s view, include debt service and principal payments so runway reflects total monthly obligations [3][8].
| Runway | Zone | What It Signals |
|---|---|---|
| 18+ months | Green | Room to invest in growth and hiring |
| 12–18 months | Yellow | Begin fundraising prep; review discretionary spend |
| 6–12 months | Orange | Active fundraising; freeze new hires |
| Under 6 months | Red | Emergency mode: cuts, bridge financing, or pivot |
Source: [7]
Runway shows how long cash lasts. Burn multiple shows how well that cash turns into growth.
If runway tells you how long your cash will last, burn multiple tells you how well that cash is turning into ARR. Put simply, burn multiple measures how much cash a company uses to generate each incremental dollar of net new ARR [1][12].
Formula: Burn Multiple = Net Burn ÷ Net New ARR [3][6]
Net new ARR includes new business ARR plus expansion ARR, minus contraction and churned ARR. Net burn should come from accounting or bank data, while net new ARR should come from your CRM or billing system. Use the same reporting period for both. Same month, same inputs [6].
Lower is better. It means the business is generating growth with less cash. A higher number usually means the company is spending too much to add each dollar of ARR [5][12]. As a rule of thumb, under 1.0x is seen as exceptional, while anything above 2.0x starts bringing hard questions [1][5][6]. If monthly ARR or spending jumps around a lot, use a 3-month trailing average to smooth the view [5][12].
| Burn Multiple | Rating | What It Signals |
|---|---|---|
| < 1.0x | Exceptional | Best-in-class; growth is outpacing cash consumed [1][5] |
| 1.0x – 1.5x | Strong | Healthy for Series A+; standard for well-run companies [1][5] |
| 1.5x – 2.0x | Acceptable | Early-stage; monitor closely [1][5] |
| 2.0x – 3.0x | Concerning | Structural inefficiency; hard board questions [1][5] |
| > 3.0x | Critical | Fundraising liability; immediate action needed [3][6] |
Boards use burn multiple to set spending guardrails and judge GTM efficiency [6]. When the ratio moves above 2.0x, it often leads to a review of costs or pricing [6]. Lenders look at this too. They want to see that new capital is turning into growth instead of disappearing into the business, which can make a company a better fit for non-dilutive financing [13].
These ranges also help you judge spending against company stage. Seed-stage companies often run at 2.5x–3.5x, while Series B companies should aim for below 1.5x [1]. And one more thing matters a lot: trend over time. A move from 3.0x to 1.5x shows the business is getting more efficient as it grows [1]. That trend also helps explain changes in cash from one month to the next.
The last metric is the simplest way to connect reported burn to the actual bank balance. If the burn multiple shows how well a company is using cash, monthly cash change shows the cash that actually moved in or out during the month.
Monthly cash change is the difference between beginning cash and ending cash for the month.
Formula: Monthly Cash Change = Ending Cash Balance − Beginning Cash Balance
You can pull it from bank feeds, accounting systems, or the cash balance on the balance sheet. It includes all cash movement: operating activity, financing activity, and one-time items.
Use monthly cash change as the full cash tie-out, and use net burn to judge operating performance. Boards look at this metric to reconcile reported burn with what happened in the bank account. Lenders use it to catch liquidity pressure before repayment problems show up. If the bank balance doesn’t line up with the burn story, this is the first place to look.
A key distinction here: finance teams often show both numbers side by side - monthly cash change for total liquidity, net burn for operational reality [3].
A single month can swing hard if it includes a big annual software prepayment or an upfront enterprise contract. That’s why many teams use a 3-month trailing average to smooth out spikes from prepayments or other one-time cash events.
Use this number as the final reconciliation check before packaging burn metrics for board and lender reports.
The next step is turning these metrics into a report that boards and lenders can scan in seconds. Many startups rely on fractional CFO services to build these reporting frameworks. A good burn report fits on one page, takes about 30 seconds to read, and answers three questions: cash on hand, burn rate, and runway.
Start every burn report with the same first row: Cash in Bank, Gross Burn, Net Burn, and Runway. Show the current month next to the prior month, all in USD.
Each figure should tie back to the reconciled ending bank balance. If the report doesn’t match what’s in the bank account, trust drops fast. For net burn, use cash collected, not invoiced revenue. And label each number clearly as Gross or Net and Recurring or Non-recurring so no one has to guess what they’re looking at.[2]
This is the reporting mistake that trips people up most often.
Use monthly cash change as the reconciliation check, then break out what caused it. In plain English: separate operating burn from financing activity and working-capital movement.
That way, the board can see the operating picture and the total cash movement at the same time, without mixing them together.
| Item | Amount | Category |
|---|---|---|
| Net Burn (Operating) | −$250,000.00 | Operating Performance |
| Debt Drawdown | +$500,000.00 | Financing (Balance Sheet) |
| Working Capital Swing | −$50,000.00 | Timing (Balance Sheet) |
| Monthly Cash Change | +$200,000.00 | Total Bank Movement |
Once the definitions and reconciliation are in place, put the main metrics side by side. This makes review faster and helps answer the questions boards and lenders tend to ask first.
Gross Burn vs. Net Burn shows the difference at a glance. Gross burn is total monthly cash outflows before revenue. Net burn is gross burn minus cash revenue received.[5]
| Metric | Calculation | Primary Use |
|---|---|---|
| Gross Burn | Total Cash Outflows | Cost structure; "what if revenue hits zero?" scenario |
| Net Burn | Gross Burn − Cash Revenue | Runway calculation; investor reporting; hiring decisions |
Scenario-based Runway helps remove surprises by showing the zero date under three conditions.[11][15]
| Scenario | Monthly Net Burn | Cash Balance | Months of Runway | Zero Date |
|---|---|---|---|---|
| Conservative (−20% Rev) | $310,000.00 | $3,844,000.00 | 12.4 | Jul. 12, 2027 |
| Base Case (Current Plan) | $250,000.00 | $3,844,000.00 | 15.4 | Oct. 14, 2027 |
| Upside (+20% Rev) | $190,000.00 | $3,844,000.00 | 20.3 | Mar. 10, 2028 |
Burn Multiple benchmarks give lenders and investors a fast read on capital efficiency.[5]
| Rating | Range | Investor Interpretation |
|---|---|---|
| Exceptional | Under 1.0x | Strong capital efficiency |
| Strong | 1.0x – 1.5x | Baseline expectation for Series A/B |
| Acceptable | 1.5x – 2.0x | Requires a strong growth story |
| Scrutiny Zone | 2.0x – 3.0x | Signals structural inefficiency |
| Red Flag | Above 3.0x | High risk of down rounds or bridge dependency |
Clean burn reports come from connected accounting, cash, and revenue data. Once you’ve set the metrics, the next job is simple: wire those metrics into the systems that produce them.
Your general ledger, bank balances, cash collections, and ARR tracking should all feed into one reconciled dataset. That’s the core idea.
And here’s a common mistake: don’t treat Stripe revenue or billing totals as cash. Cash means reconciled bank movements. If the money hasn’t shown up in the bank and been matched, it shouldn’t drive burn reporting.
| Source System | Data It Provides | Metric It Feeds |
|---|---|---|
| General Ledger | Operating cash flow | Gross Burn |
| Bank Statements | Ending cash balance | Runway, Monthly Cash Change |
| Cash Collections | Cash received | Net Burn |
| CRM / Billing | Net new ARR added | Burn Multiple |
| HRIS / Headcount Plan | Committed and modeled hires | Forward Gross Burn |
Connected systems are only useful if every report runs on the same formulas.
Write one definition for each metric and use it everywhere: dashboards, board decks, and lender packages.
That means:
If one team uses a different version of ARR or burn, the numbers drift fast. Then finance ends up spending time explaining mismatches instead of helping people make decisions.
After the inputs and definitions are fixed, the next move is automation.
Automate net burn, runway, and burn multiple so monthly reporting updates without manual rebuilding. That cuts out spreadsheet rework and makes the package easier to trust month after month.
When runway drops to a trigger threshold, the system should flag it on its own so leadership has time to act before the situation becomes urgent [14][8].
Phoenix Strategy Group helps growth-stage companies automate reconciled burn reporting.
No single metric tells the full story. You need the full set to see the cost structure, cash loss, runway, capital efficiency, and how the bank ties back to the report. That’s why consistency matters more than any one month.
The real question behind every burn report isn’t whether burn is too high. It’s whether the growth that burn is buying is worth the cost of capital. In that frame, consistency becomes the edge.
Consistency builds over time. When the numbers start moving in the wrong direction, boards can step in before things turn urgent.[1][16] Lenders also get a clearer view of liquidity risk without extra back-and-forth or having to sort out mismatched figures. When the numbers are consistent, comparable, and clearly labeled, burn reporting turns into a decision tool. And when burn metrics are defined the same way every month, board and lender reports become faster, clearer, and more useful.
Start with net burn rate. Gross burn tells you what you spend each month, but net burn is the better number to watch because it shows the cash you’ve actually brought in and how fast your cash balance is shrinking.
Once you have your net burn, look at it alongside runway. That gives you a clear view of how long the business can keep operating before you need more funding.
Burn should be reported on a cash basis, not an accrual basis. The point is simple: burn tracks the money leaving your bank account, so it should reflect when cash actually comes in or goes out.
Accrual accounting can muddy the picture. A customer invoice might show up as revenue before the cash hits your account, and an unpaid vendor bill can make costs appear before you've sent the money. Those timing gaps can skew your view.
Cash-based reporting gives you a cleaner read on your bank balance and a more accurate sense of runway.
Update and review burn metrics monthly. That steady cadence helps you spot issues early, avoid nasty surprises, and build trust with your board.
When you report to the board, use a three-month trailing average for net burn instead of a single month. One month can swing due to a one-time expense or a seasonal spike, so the average gives a steadier read on the business. Also, state clearly whether you're reporting gross burn or net burn.