Published on
July 10, 2026


Most growth mistakes happen when cash goes out long before profit comes back. If I were making a call on a making a call on a $150,000 hire50,000 hire, a price change, a new market launch, or a product build, I’d judge it with the same four-part check: costs, returns, timing, and risk.
Here’s the short version:
A few numbers from the piece stand out:
My takeaway is simple: I wouldn’t approve a growth move because it sounds good, looks big, or feels urgent. I’d approve it only if the math shows enough net value, in enough time, without putting cash at risk.
That’s the lens this article uses for hiring, pricing, market entry, and product expansion.
Build the model in this order: costs, returns, timing, and risk.
That order matters because every growth call comes down to the same tradeoff: cash leaves now, and value comes back later. So start with the costs that hit cash first. Then map the returns, the timing of those returns, and the risk that the plan slips or underperforms.
Every growth decision has two layers of cost: direct and indirect.
Direct costs are the easy part. Include base pay, benefits, payroll taxes, software, and any other direct spend tied to the decision. For example, a new hire at $120,000 in base salary does not cost just $120,000. Add a 25% to 30% benefits load, and the true annual cost lands between $150,000 and $156,000 before tools or software licenses.
Indirect costs are where a lot of models miss the mark. You need to count management time, onboarding, training, and any profit lost when people are pulled away from higher-return work.
Opportunity cost is often the largest hidden cost in a growth decision.
Split returns into two buckets: hard financial impacts and soft strategic benefits. Only the hard impacts should feed your NPV calculation.
That means modeling returns from:
Not just top-line revenue.
Soft benefits also matter. Things like improved market access, stronger brand positioning, or the ability to hold a price premium can change the picture in a big way. But they are tougher to measure with confidence. So treat them as scenario adjustments, not base-case revenue. Keep them out of the base case.
At that point, the model still isn't done. You also need to place those returns on a timeline.
This is where a good-looking plan can fall apart.
Even if the headline numbers seem strong, timing can change the result. Costs begin now. Revenue usually shows up later. So both payback period and NPV need to pass the test.
Discounted cash flow (DCF) turns future returns into today’s dollars by applying a discount rate that reflects your cost of capital. For growth-stage businesses, that rate is commonly 12% to 20%. Discounted inflows minus discounted outflows gives you NPV. If NPV is positive, the decision is expected to create economic value. If NPV is negative, it doesn’t - even when the revenue forecast looks attractive on the surface.
To pressure-test the model, run at least three scenarios:
In the downside case, test lower lead volume, weaker close rates, or a delayed launch. Then check two things: does NPV stay positive, and does payback still fit inside your runway?
Use this framework for hiring, pricing, market entry, and product expansion.
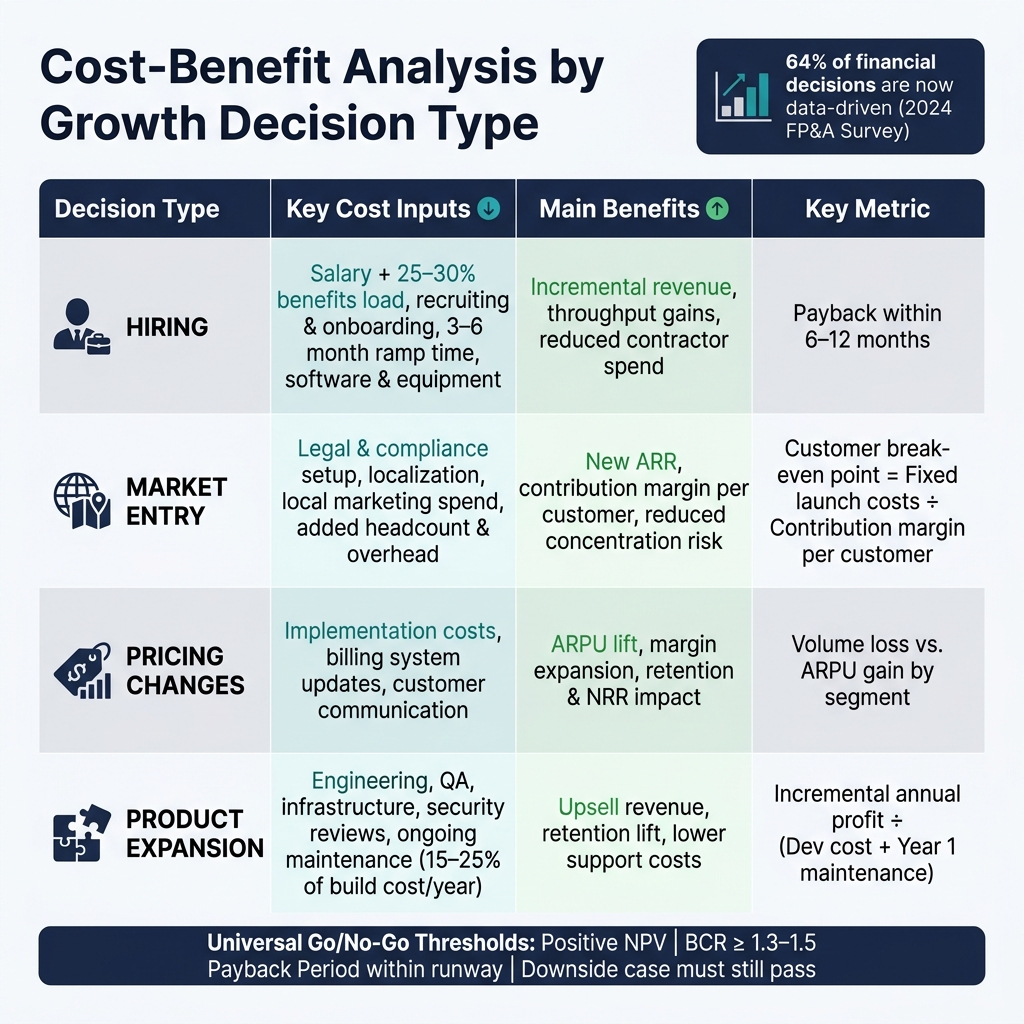
Cost-Benefit Analysis Framework for Growth Decisions
Now that the framework is in place, the next step is using it on the growth calls founders make all the time. The logic stays the same: look at costs, returns, timing, and risk. What changes is the input. A hire should not be judged the same way as a pricing test or a product build. Same process, different math.
Start with the fully loaded annual cost of the role. That means more than salary. Include taxes, benefits, recruiting costs, onboarding, software, and equipment. Also account for the 3–6 month ramp period, when output is still below full speed.[1][4][6]
Then tie the hire to a clear output you can measure. For a sales rep, that usually means added quota attainment multiplied by gross margin. For an operations hire, the gain may show up in lower contractor spend, fewer founder or executive hours lost to admin work, or more output from the same team.
Once you have both sides, calculate the payback period:
total upfront hiring and ramp costs divided by net monthly benefit
A practical internal bar is payback within 6–12 months. In plain English, the hire should improve results before it starts putting real pressure on your cash runway.[9][10][12]
For a new market, the cost side usually includes legal and compliance setup, localization, local marketing spend, added headcount, and any new overhead. The return side includes new ARR, contribution margin per customer, and less concentration risk. The core number here is the customer break-even point. Divide fixed launch costs by contribution margin per customer, and you get the number of customers needed for the market to pay for itself.[2][5]
Pricing changes need a different lens. Before changing your price structure, estimate:
Do this by segment, not in one blended model, because price sensitivity changes across cohorts. And when you can, run a small test before a full rollout.[8][11][13][14]
Product bets are where teams often miss the full cost. The build cost is not just engineering time. A full model should include development hours, QA, infrastructure, security reviews, and ongoing maintenance, which usually runs 15–25% of the original build cost per year.[3]
On the return side, look at the gains that matter most: upsell revenue from higher-tier plans, better retention from stronger product fit, and lower support costs from fewer tickets. If several features are fighting for the same engineering time, use a simple return formula:
incremental annual profit from the feature divided by total development plus first-year maintenance cost
That gives you a clean way to compare one option against another.[3][7] From there, pick the feature with the best risk-adjusted return and a strong fit with the business. Start with the highest-return option, then pressure-test it for timing and downside risk.
The table below sums up the main cost and return inputs for each decision type.
| Decision | Key Cost Inputs | Main Benefits |
|---|---|---|
| Hiring | Salary, benefits, recruiting, onboarding, ramp time | Incremental revenue, throughput, reduced contractor spend |
| Market Entry | Launch costs, compliance, local marketing, overhead | New ARR, contribution margin, break-even timing |
| Pricing Changes | Implementation, billing updates, communication | ARPU lift, margin expansion, retention and NRR impact |
| Product Expansion | Engineering, QA, infrastructure, maintenance, opportunity cost | Upsell revenue, retention lift, support cost savings |
Once the model is built, turn it into a simple pass/fail rule. Put that rule in place before you approve any growth move.
Four metrics should drive the call.
Net benefit is the most direct one: total projected benefits minus total costs over a set time frame, usually 24 to 60 months. If that number is negative, the project fails the first test.
Benefit-cost ratio (BCR) shows how much value you get for each $1 spent. Many high-growth firms look for 1.3 to 1.5 or more on discretionary projects so they have some cushion if things don't go as planned.[15][16][25]
NPV checks whether the move adds economic value after accounting for the time value of money.[20][21][22]
Payback period gets to the cash question: how long will it take to earn back what you put in?
Set tougher cutoffs when cash is tight. Ease them a bit after profitability or a new funding round. The big point is to write those thresholds down before you review any one project. Otherwise, it's too easy to move the goalposts because you want a certain idea to work.
Use those thresholds before comparing one initiative against another.
A single forecast isn't enough. A project should clear the bar in the downside case, not just the base case. If it only works under aggressive assumptions, that's a sign to pause, reshape it, or wait - not approve it.[17][23]
For companies that are tight on cash, the conservative case should drive the decision. If that version shows a negative NPV or a payback period longer than your runway, the answer is no.
Every major initiative - usually anything above $50,000 or 5% of quarterly operating expenses - should come with a short written business case. That write-up should cover the main assumptions, the financial metrics, the scenario summary, and the person who owns the result.[18][24]
That owner should track actual performance, explain gaps, and call out drift early. Monthly or quarterly variance reviews - where FP&A compares actual revenue, costs, and margins against the approved case - turn this from a one-off exercise into a working system.[19][24]
That way, growth decisions stay comparable, reviewable, and tied to clear ownership.
Growth decisions tend to go off track when costs, returns, timing, and risk aren't clear before money goes out the door. Cost-benefit analysis puts that tradeoff in plain view.
That matters more than it may seem at first glance. Big revenue numbers can look great in a board deck and still hide weak economics. A $2,000,000 revenue opportunity can be worse than a $600,000 margin gain if the risk-adjusted value comes in lower. In practice, good capital allocation is driven by risk-adjusted value, not headline upside.
You can see this shift in how finance teams now judge decisions. A 2024 FP&A survey cited by Ramp found that 64% of financial decisions are now data-driven, up 12 points from earlier levels.[26]
Phoenix Strategy Group helps growth-stage companies turn operational data into financial decisions through FP&A, fractional CFO support, data engineering, and strategic advisory.
Use that discipline as a repeatable operating habit, not a one-off exercise.
Apply the same rigor to a $150,000 hire and a $1,500,000 expansion. Treat both as capital decisions that need the same clear-eyed review.
Use the payback period when cash flow, liquidity, and fast capital recovery matter most. It works well when you need to protect runway and keep risk in check.
Use NPV when you want to judge long-term profit and overall value creation. It’s a better fit for larger or more complex projects where the full stream of future cash flows matters.
In practice, many finance teams use both. That way, they can balance near-term cash needs with long-term growth.
Opportunity cost is the value of the next-best option you pass on. To estimate it, compare the investment you want to make with the return you’d miss by not putting that money, time, or effort into something else.
Use an integrated financial model to compare initiatives side by side. Look at metrics like Net Present Value (NPV), Internal Rate of Return (IRR), and payback period. Then add two practical filters: execution risk and leadership capacity.
A project can look strong on paper and still be the wrong call if the team can’t carry it well or if the odds of delay, cost overruns, or weak adoption are too high.
The assumptions that matter most are the ones tied to revenue drivers, cost increases, and cash needs. Start by pressure-testing the model against lower revenue, higher interest rates, and sudden jumps in operating costs.
It also helps to map out the break-even point so you can see exactly when a project no longer makes sense. On the cash side, keep a liquidity buffer that includes at least a 10% contingency. Then track burn rate and runway closely, because that's often where small problems turn into big ones.