Published on
July 10, 2026

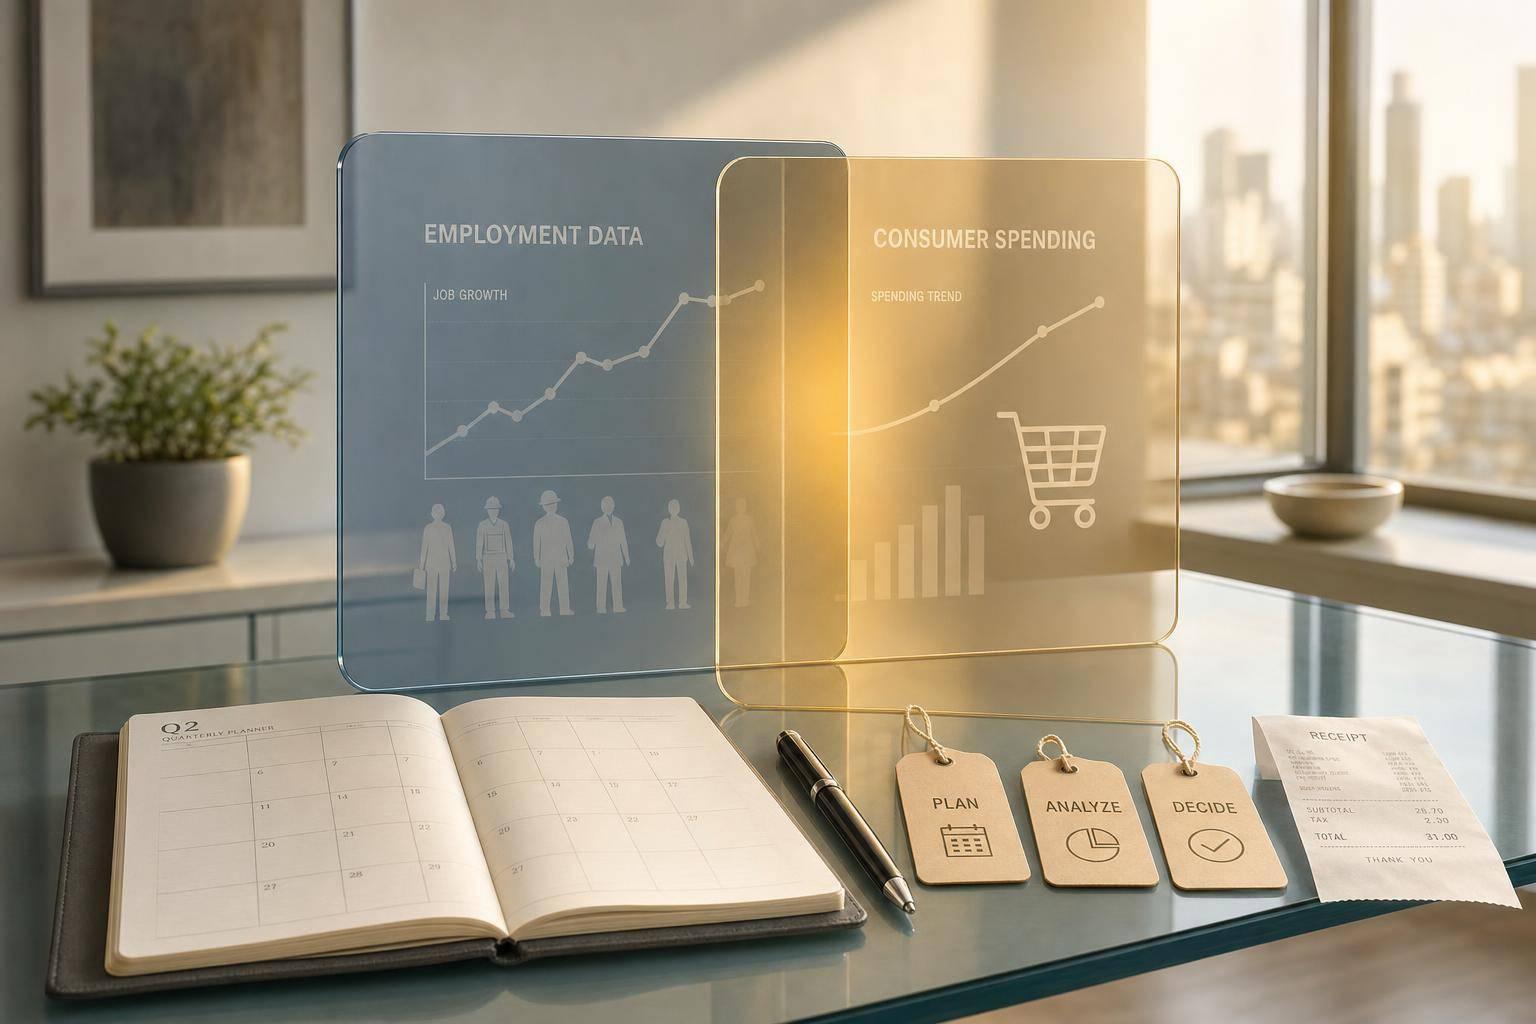
If I need an early read, I look at employment data first. If I need to make a near-term sales call, I look at spending data. That’s the core takeaway.
Here’s the simple split:
If I use just one data set, I can miss part of the picture. Labor numbers can point to demand and cost shifts before they hit my sales. Spending numbers tell me whether those shifts are already showing up in the market.
Best use case? I’d use labor data to plan the next quarter, then use spending data to check and adjust what I do next.
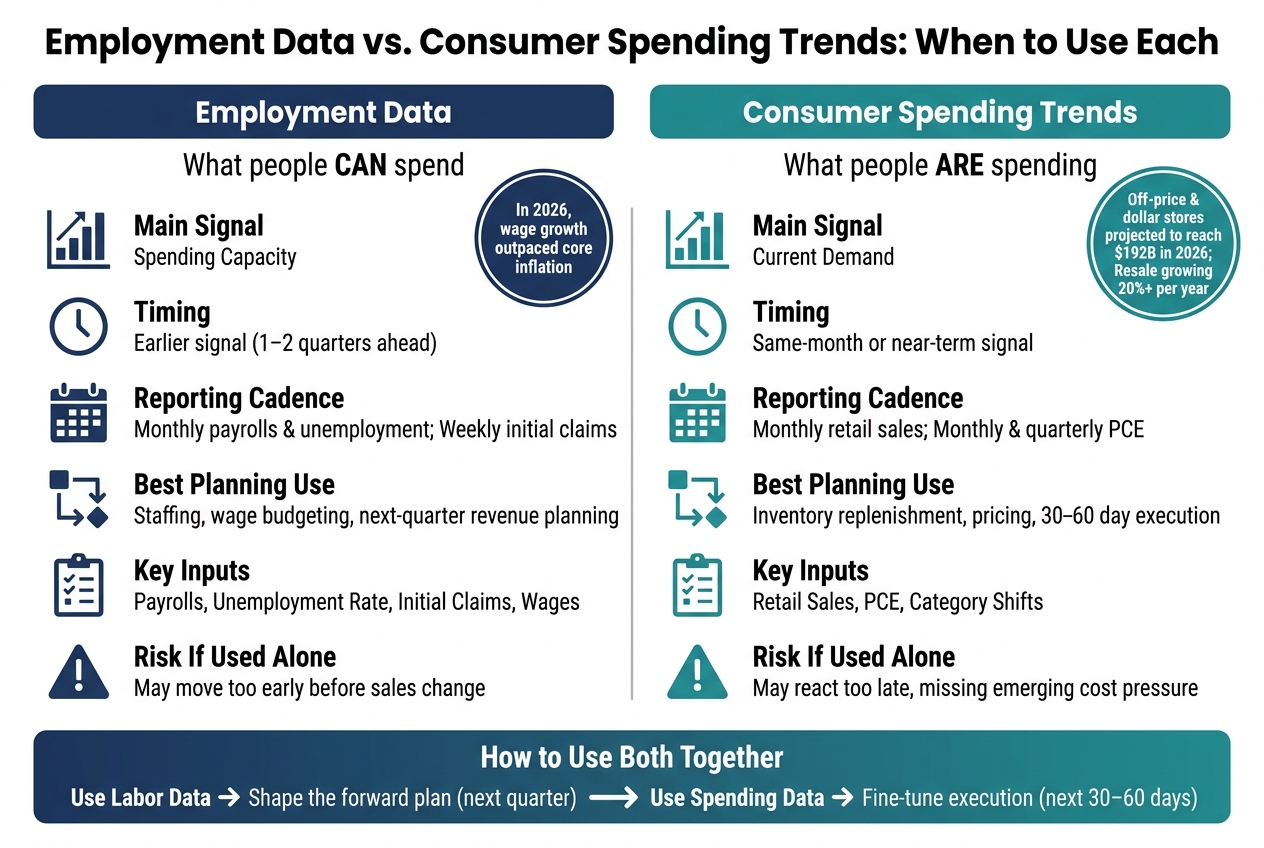
Employment Data vs Consumer Spending Trends: When to Use Each
| What it shows | Employment data | Consumer spending trends |
|---|---|---|
| Main signal | Spending capacity | Current demand |
| Timing | Earlier | Same-month or near-term |
| Best for | Hiring, wage budgets, revenue planning | Pricing, promos, inventory, reorders |
| Main inputs | Payrolls, unemployment, claims, wages | Retail sales, PCE, category shifts |
| Risk if used alone | I may move too early | I may react too late |
So if I’m trying to decide what customers may do next, I don’t treat these as competing signals. I treat them as a sequence: labor data first, spending data second.
Labor data works best when you want an early read on where demand may head next and what labor might cost you. Payrolls, unemployment, claims, and wages each show a different piece of that picture.
Nonfarm payrolls give you the broadest view. When more people are working, more households have money coming in. That tends to show up in demand one to two quarters later [3].
The unemployment rate helps you see how much pressure is building in hiring and pay. When the market is tight in skilled trades and logistics, wages in those areas often move up [2]. That matters for demand planning, but also for your own hiring budget.
Initial jobless claims are the fastest early warning sign. They can point to softer conditions sooner than monthly data like the unemployment rate [2]. If claims start to climb, household income may be getting squeezed, and demand can weaken after that.
| Indicator | Signal | Timing |
|---|---|---|
| Nonfarm Payrolls | Broad income expansion | 1–2 quarters |
| Unemployment Rate | Wage and hiring pressure | Ongoing hiring cost assessment |
| Initial Jobless Claims | Early warning of softening conditions | Weeks ahead of monthly data |
Use payrolls and claims to figure out the likely direction of demand. Then use wages to check whether you have room to price and what your staffing plan may cost.
Wages add the next layer. They show whether labor market strength is also boosting household spending power and your own cost base.
When wages rise, spending usually gets support. For consumer-facing businesses, that can also mean more room for price increases. For inventory-heavy businesses, it can point to stronger demand ahead. In 2026, wage growth has continued to outpace core inflation, which helps explain why actual purchase behavior has stayed steady even as consumer sentiment surveys have weakened [2].
On the cost side, the effect is direct. If you run a service business or any labor-heavy operation, higher wages push up your cost structure. Use local labor data in the areas where your customers or employees are concentrated. And check staffing budgets at least one quarter ahead so margin slippage doesn't catch you off guard.
The next step is to see whether that income is already turning into actual purchases.
Employment data tells you what people can spend. Consumer spending data tells you what they’re actually buying. That’s why spending data is the better short-term read for pricing, promotions, inventory, and staffing. Use retail and PCE data to check whether higher income is turning into demand you can see in sales.
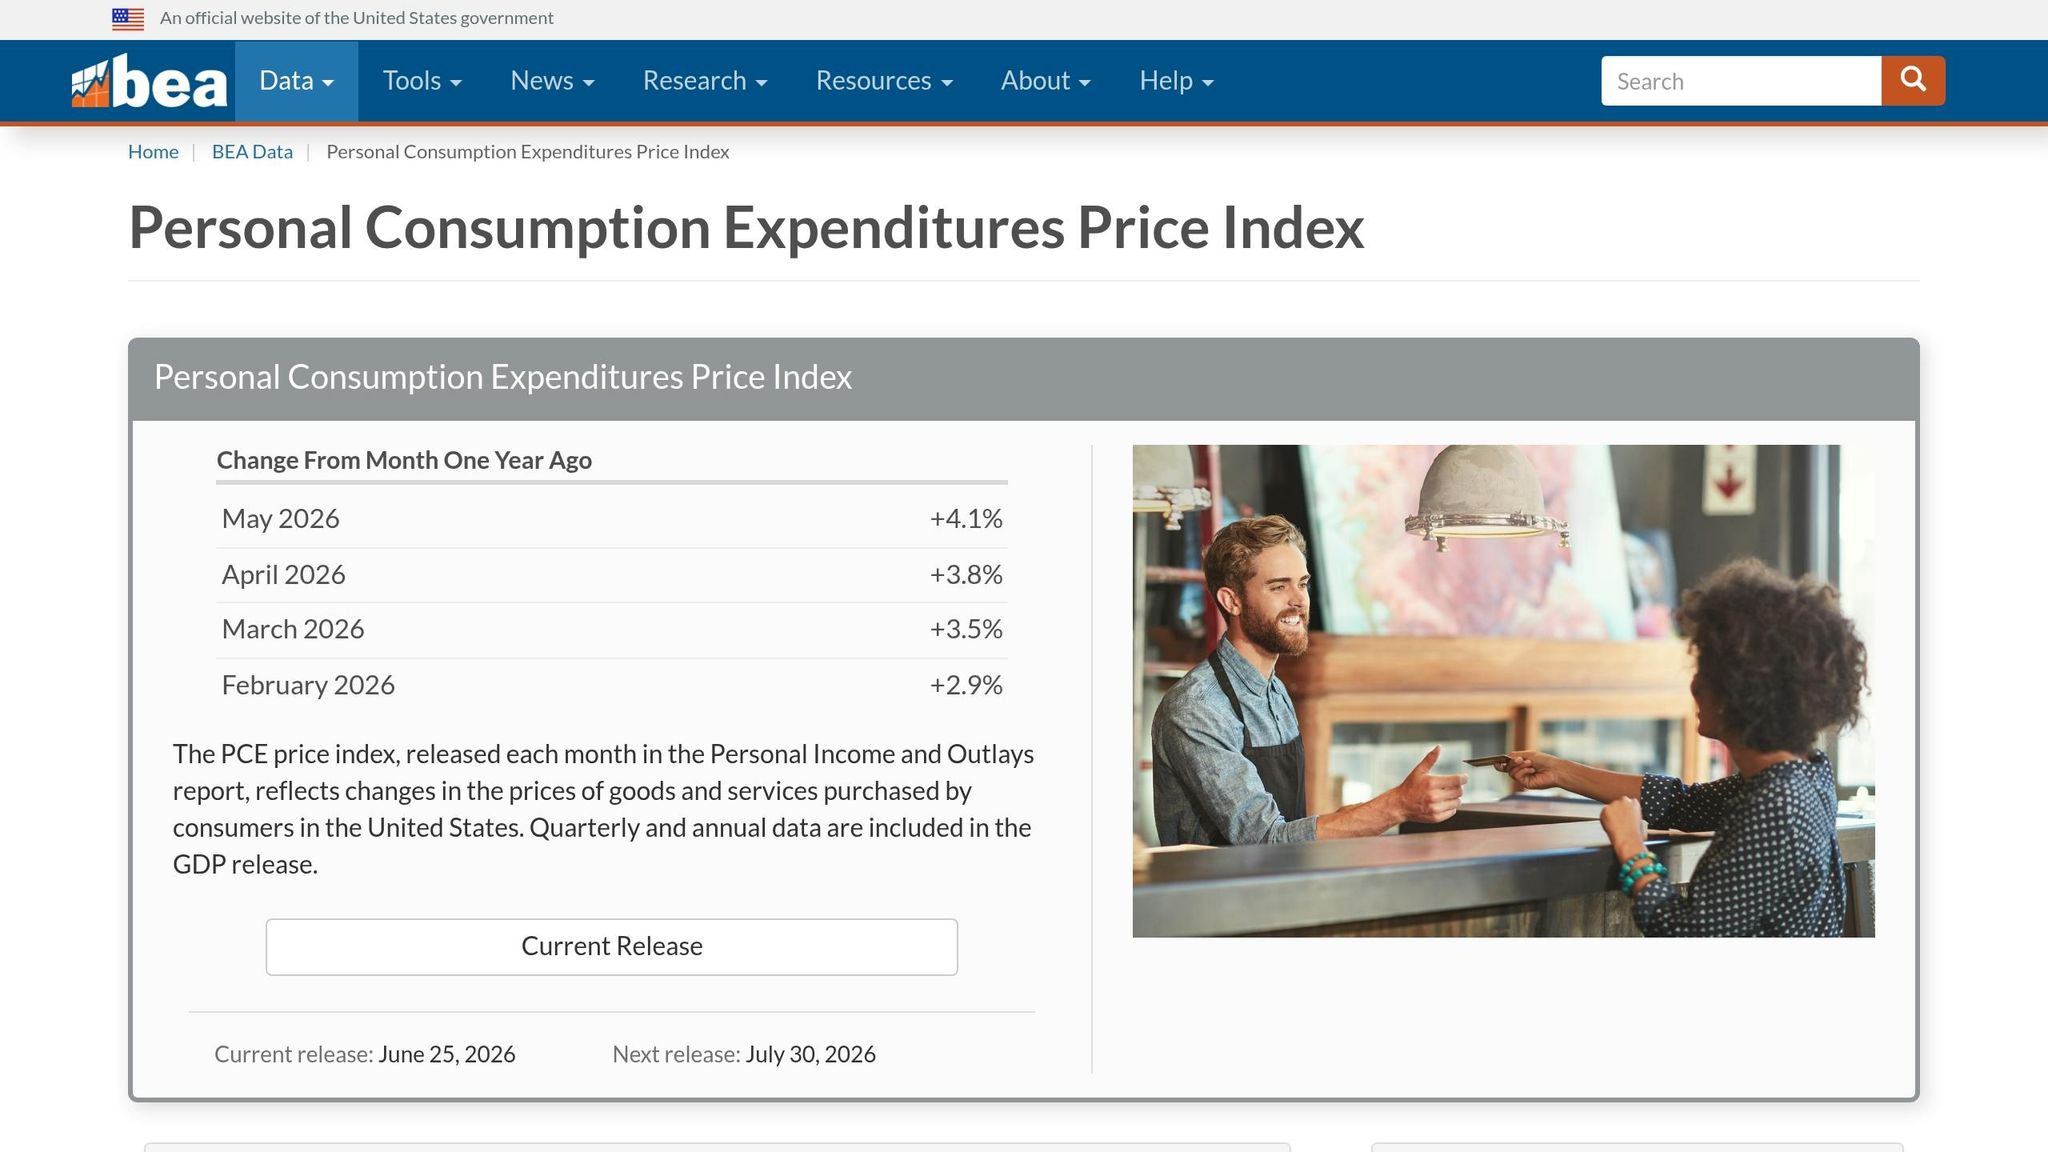
The Census Bureau's monthly retail sales report is the clearest way to track current buying behavior by category [2]. Retail sales show when demand is already showing up as revenue, which makes the report useful for pricing moves, promo timing, and reorders.
It also helps answer a simple but important question: Is my revenue softening because of something I'm doing, or because the whole market is pulling back? The answer affects when you change pricing, run promotions, adjust inventory, or shift staffing.
Retail demand usually flows into freight and replenishment decisions within four to six weeks [2]. If you run a product-based business, that lag is your planning window. When retail sales data starts to strengthen, reorder and logistics calls need to happen within weeks, not months.
Once you know total spending, the next step is figuring out which categories are getting the money.
The more useful signal is share gain by category. In 2026, off-price and dollar store formats are projected to reach $192 billion, while resale in apparel and accessories is growing at over 20% per year [1]. At the same time, mid-market specialty retail is losing ground in the middle [1].
That split has a direct effect on assortment and pricing. Shoppers are comparing prices in real time and leaning toward perceived value instead of defaulting to brand loyalty [1]. In plain English, keep prices steady on the items people use as their value check. Then protect or expand margins on discretionary products where brand pull still matters.
Category-level data also helps with inventory allocation. Electronics and apparel move through different supply chains, so category data lets you position inventory earlier [2]. If you know which categories are gaining share in the current cycle, you can line up inventory before demand peaks instead of chasing it after the fact.
That’s the kind of detail that helps you place inventory and set prices with more precision.
The main difference comes down to timing: labor data tends to show where things are headed, while spending data tells you whether that shift is showing up in the market now.
| Feature | Employment Data | Consumer Spending Trends |
|---|---|---|
| Timing | Earlier signal | Same-month signal |
| Reporting Cadence | Monthly payroll and unemployment data; weekly initial claims | Monthly retail sales; monthly and quarterly PCE |
| Best Planning Use | Staffing, wage budgeting, and next-quarter revenue planning | Inventory replenishment, pricing, and 30–60 day execution |
| Main Risk If Used Alone | Can prompt premature cuts or expansions before sales change | Can miss emerging labor-cost pressure and demand turning points |
A simple way to think about it: use labor data to shape the forward plan, then use spending data to fine-tune execution.
Employment data matters most when you need to move before your sales figures change. If the four-week average in weekly claims starts climbing, that can be a cue to slow hiring and rework your next-quarter revenue forecast. The same goes for wages. If pay is rising faster than your pricing, margins can get squeezed even if top-line revenue still looks steady.
Spending data helps most when the call you need to make is immediate and tied to sales. A change in category demand can appear in spending data before employment starts to weaken. If you wait for labor data to confirm it, you may already be late on inventory moves. That makes spending trends a better fit for orders, promotions, and pricing, but not for 90-day staffing plans.
Use labor data for the next quarter, and use spending data for the next 30 to 60 days.
Start with labor data to set your forward view. Look at:
Those inputs help shape staffing moves and revenue scenarios for the next quarter.
Then switch to spending data for your execution window. Focus on category-level retail sales and PCE trends from the last one to two months, and compare them against your own sales performance.
At the decision level, the big difference comes down to timing. Neither data set works well on its own. Employment data gives you an early read on demand and costs. Consumer spending data gives you confirmation. It shows what customers are buying right now.
In early 2026, University of Michigan consumer sentiment slipped, yet retail spending kept rising for seven months [2]. That gap shows why looking at only labor data or only spending data can point you in the wrong direction.
For founders, the rule is simple:
Use payroll growth, unemployment rates, initial claims, and wage trends to shape your forward plan. That means staffing levels, labor budgets, and next-quarter revenue scenarios. Then use retail sales and personal consumption expenditures (PCE) data to steer near-term execution, like inventory orders, pricing changes, and promo timing.
Use both in budgeting, staffing, and inventory reviews. Together, they support the four decisions this article has focused on: forecasting revenue, setting prices, planning inventory, and adjusting staffing. Labor data helps you prepare. Spending data helps you confirm.
Start with your internal operating data. Metrics like pipeline conversion, sales cycle length, churn, and customer payment timing usually tell you what’s changing in your business before broad market data does.
Labor market and consumer spending data can add context. But your internal signals should be the main check on what’s happening and what to do next.
Use a mix of real-time monitoring and regular review cycles. Update labor cost forecasts weekly. Refresh broader revenue and expense forecasts monthly or quarterly.
Track key metrics like cash flow and expenses daily with dashboards. That way, you can catch major variances, especially anything above 10%, before month-end.
When labor and spending trends point in different directions, don’t hang everything on one data point. Step back and look for patterns instead. The best way to do that is to compare your own operating data with broader macro signals.
Your internal numbers usually give you the earlier clue. Things like sales cycle length, pipeline conversion, and customer payment timing tend to move faster and reflect what’s happening in your business, not just the market at large.
If the picture still looks mixed, treat it like a transition period. That usually means staying cautious, running scenario models, and keeping labor and inventory plans flexible until the trend comes into focus.