Published on
May 23, 2026


Expanding manufacturing globally might seem cost-effective, but hidden expenses can quickly add up. Here's what you need to know:
| Cost Factor | Key Consideration |
|---|---|
| Real Estate & Facilities | High upfront costs, energy access critical |
| Labor Costs | Varies by region; laws and benefits add burden |
| Supply Chain & Logistics | Tariffs and lead times impact total cost |
| Energy & Utilities | Rates vary; hidden fees common |
| Technology Infrastructure | Compliance and connectivity challenges |
| Financing & Taxes | Fixed debt, new global tax rules |
| Risk Contingencies | Buffers needed for currency and supply risks |
Effective cost modeling is essential to avoid surprises and build a financially sound expansion strategy.
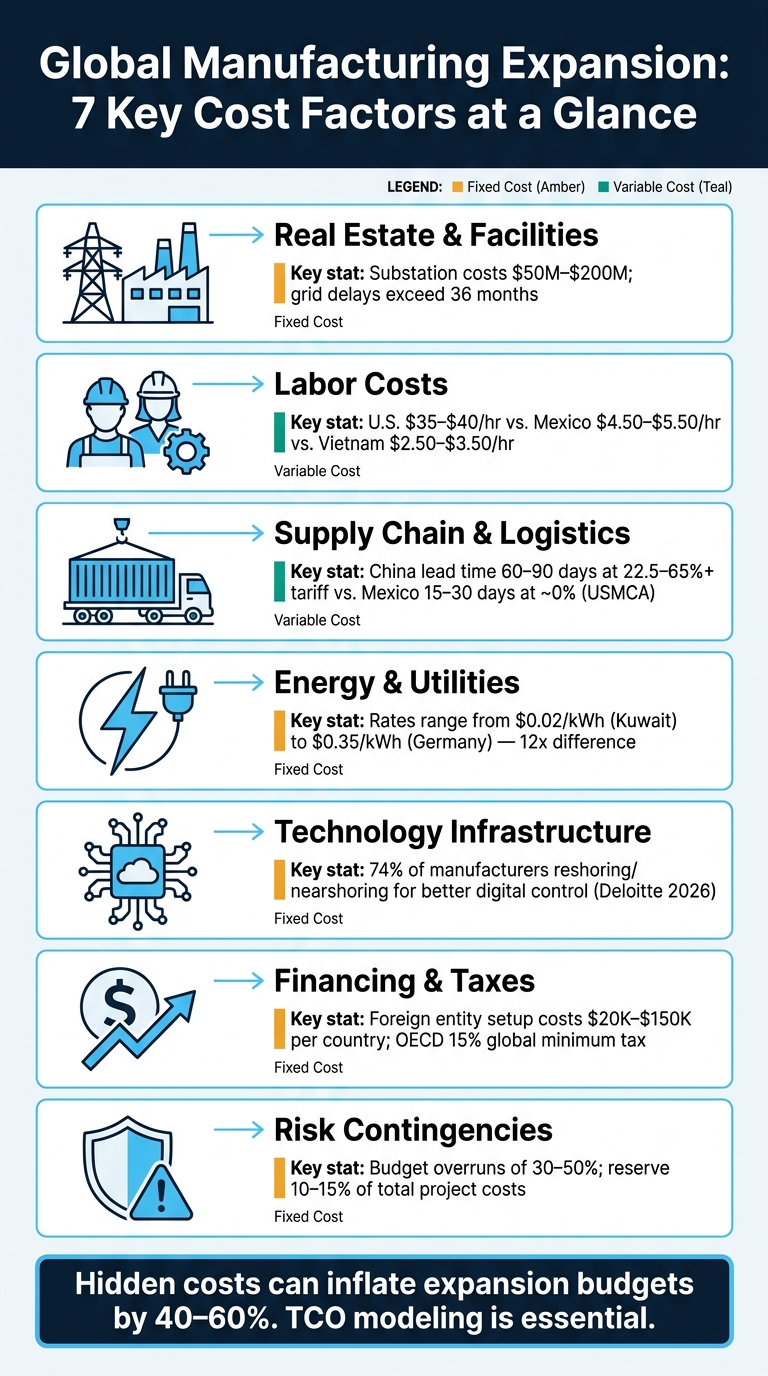
Global Manufacturing Expansion: 7 Key Cost Factors at a Glance
The old playbook of finding inexpensive locations and launching quickly doesn’t cut it anymore. King White, CEO of Site Selection Group, explains it well:
"In many cases, real estate is no longer the largest line item. It is one component of a much broader economic equation." [3]
Today, the cost of a facility is calculated by its total operating cost (TCO), which factors in utility infrastructure, logistics, permitting timelines, and regional incentives. Among these, energy infrastructure has become a game-changer.
Access to energy is now a make-or-break factor. In fact, grid connection delays have surpassed greenfield manufacturing project overruns in the U.S. and EU [4]. For example, power transformers can take as long as 36 months to arrive [5], and building substations can cost anywhere from $50 million to $200 million [6]. These challenges are especially daunting for industries that depend on heavy assets, like semiconductors, EV batteries, and pharmaceuticals.
Fixed costs play a major role in the equation. Modifying facilities can cost between $20 and $80 per square foot, while upfront electrical demand capacity costs hover around $140 per kVA [8]. On the other hand, flexible lease structures - like industrial triple-net (NNN) leases in Mexico, which range from $0.53 to $0.79 per square foot per month [8] - offer some breathing room. This clear distinction between fixed and variable costs is crucial for understanding the full scope of expansion expenses.
Consider recent examples: Lenovo pledged $2 billion for a new hub in Riyadh in early 2025 [2], and Eli Lilly started building a $2.5 billion pharmaceutical facility in Germany in May 2024 [2]. These decisions highlight how infrastructure readiness and reliability now carry more weight than just the initial price tag.
Economic incentives can ease the financial burden, often covering 10% to 20% of a project’s total investment [3]. However, these benefits only materialize if they’re factored into the location strategy from the very beginning. Grasping the balance between real estate and infrastructure costs is essential for analyzing fixed and variable expenses in global manufacturing projects.
After infrastructure, labor costs stand out as a major factor that can heavily influence expansion budgets. But focusing solely on hourly wages doesn’t give the full picture. Labor costs also include benefits, insurance, paid leave, social security contributions, and various region-specific requirements. As Tetakawi aptly states:
"The manufacturer who picks a country based on hourly wages alone will be surprised by what shows up on the P&L." [10]
For context, fully burdened labor costs in the U.S. average around $35–$40 per hour. In Mexico, the same costs range from $4.50–$5.50 per hour, representing a potential 60% savings. However, making a straightforward comparison can be tricky when you account for tariffs, shipping times, and regulatory challenges.
One advantage in the U.S. is at-will employment, which allows companies to adjust their workforce more easily. In contrast, stricter labor laws in some countries make workforce costs largely fixed. For example, in France, employer burdens can reach 40–45% of gross salary, and firing employees under protections may involve delays of 12–18 months and hefty legal fees [11][12]. Similarly, in Brazil, employers face a total burden nearing 70% of gross salary due to requirements like a mandatory 13th-month salary, vacation accruals, and severance contributions [11]. These fixed costs can become a significant challenge during economic downturns.
Unionization adds another layer of complexity. Within the U.S., union membership rates vary widely - from 21.9% in New York to just 3.1% in North Carolina. This disparity affects workforce flexibility, the likelihood of labor disputes, and long-term budget planning [9]. Ryan N. Parsons of Foley & Lardner LLP sums it up well:
"Labor is just one piece of the reshoring puzzle - but it can be the piece that determines whether new U.S. operations thrive or stall." [9]
In Mexico, a popular strategy is to use shelter models, where manufacturers operate under the legal and HR framework of a third party. This approach can reduce launch times from 12–18 months to just 6 months, enabling companies to benefit from lower labor costs without the burden of establishing a full local entity [10].
The table below highlights how labor costs and considerations vary across regions:
| Region | Fully Burdened Labor Cost (Hourly) | Key Labor Consideration |
|---|---|---|
| United States | $35.00 – $40.00 | At-will employment; high regional variation in benefits and unionization [9][10] |
| Mexico (USMCA) | $4.50 – $5.50 | Shelter models available; over 130,000 engineering graduates annually [10] |
| China (Coastal) | $8.00 – $10.00 | Rising wages; U.S. tariffs (145%+) can offset cost advantage [10] |
| Vietnam | $2.50 – $3.50 | Lowest labor cost; thinner Tier-2/3 supplier ecosystem [10][13] |
| Germany | ~21% employer burden | Highly skilled workforce; notice periods up to 7 months [11] |
| France | 40% – 45% employer burden | High OECD burden; significant termination complexity [11][12] |
| Brazil | ~70% employer burden | Includes mandatory 13th-month salary, vacation accruals, and severance fund contributions [11] |
This diverse mix of labor costs and regional regulations highlights the importance of carefully evaluating both fixed and variable workforce expenses when planning global manufacturing operations.
Supply chain costs can be more intricate than they first appear. It’s not just about raw material prices or freight charges. When you bring tariffs, inventory carrying costs, lead times, and supplier contracts into the mix, predicting costs becomes a whole new challenge.
Take tariffs, for instance. They've become a major hurdle for cost stability. The U.S. effective tariff rate jumped from 2.2% at the end of 2024 to about 17% by April 2025 [7]. For goods imported from China, tariffs under Section 301 and Section 122 can push rates even higher - sometimes reaching 22.5–65% or more [15]. What might seem like a profitable sourcing decision can quickly turn into a financial headache.
Then there’s the issue of lead times. Sourcing from Asia often means 60–90 days of transit, which ties up working capital and drives up inventory costs. For every 1% increase in interest rates, inventory carrying costs can add around 2.5% to the Total Cost of Ownership (TCO) when transit times exceed 30 days [7]. On the other hand, nearshoring to Mexico can cut lead times to just 15–30 days and, for goods that qualify under the USMCA, eliminate tariff costs entirely [15].
Here’s a quick comparison of how sourcing origins impact lead times, tariffs, and cost predictability:
| Origin | Lead Time to U.S. | Effective Tariff Rate | Cost Predictability |
|---|---|---|---|
| China | 60–90 days | 22.5%–65%+ [15] | Low (high tariff volatility) |
| Vietnam | 60–90 days | ~15% [15] | Moderate |
| India | 75–120 days | ~15% [15] | Moderate |
| Mexico (USMCA) | 15–30 days | ~0% [7][15] | High |
Many manufacturers are now opting for hybrid sourcing models. This approach involves sourcing components offshore where cost savings are significant, while completing final assembly nearshore or domestically. This strategy not only shortens lead times but also improves control over intellectual property. Paul Liang of Mingsung International Logistics captures this shift perfectly:
"The smart frame for 2026 isn't 'where to manufacture.' It's 'which stages of production go where, weighted by tariff, labor, lead time, and risk.'" [7]
When evaluating sourcing options, it’s important to look beyond just supplier quotes. Consider the total landed cost, which includes freight, tariffs, insurance, quality control, and working capital. A supplier with a low quote but a 90-day lead time and high tariff exposure might end up costing more than a nearshore alternative. This kind of supply chain analysis ties directly into the broader cost strategies discussed earlier, and it’s just as relevant for decisions involving energy, technology, and financing in the sections ahead.
When planning global manufacturing expansion, energy costs often get underestimated, despite being as critical as real estate or labor. These costs include both fixed and variable components, but they’re more complex than they appear at first glance. Industrial electricity bills, for example, are not just about generation costs. They also include network charges, taxes, policy levies, demand or capacity charges, and penalties for reactive power. Take Germany as an example: only 35% of the electricity bill reflects actual generation costs, while the remaining 65% consists of taxes, grid fees, and policy surcharges [16]. These layers of cost vary widely across markets.
The price differences between regions are staggering. Industrial electricity rates range from as low as $0.02/kWh in heavily subsidized markets to over $0.35/kWh in regions with high policy costs - a more than 12-fold difference [16]. For instance, a mid-sized factory consuming 10 GWh annually would pay around $300,000 in Kuwait, compared to $3.5 million in Germany [16]. Even within the U.S., the range is significant. In 2025, North Dakota’s industrial rate was 7.5¢/kWh, while California’s reached 21.62¢/kWh [17].
| Market | Representative Countries | Industrial Rate (USD/kWh) |
|---|---|---|
| Subsidized/Hydro | Kuwait, Saudi Arabia, Quebec (Canada) | $0.02 – $0.07 |
| Moderate/Resource Rich | USA (Average), Norway, India | $0.08 – $0.12 |
| High Policy/Import Dependent | Germany, Italy, Japan, UK | $0.23 – $0.38 |
(Source: HarmoniQ Technologies [16], U.S. Chamber of Commerce [17])
Energy costs aren’t just about consumption - they also involve fixed investments in infrastructure. For manufacturers exporting to the EU, regulatory developments like the Carbon Border Adjustment Mechanism (CBAM) add another layer of complexity. Starting January 1, 2026, importers of carbon-intensive goods such as steel, aluminum, and cement must purchase certificates priced at €75.36 per tonne of CO2e [18]. This cost will escalate quickly: taxable emissions begin at 2.5% in 2026, rise to 48.5% by 2030, and reach 100% by 2034 [18]. Ignoring these changes could lead to significant cost burdens for EU-bound goods.
"Energy is no longer a variable operating expense. It is a fixed constraint shaping unit economics, siting decisions, and capital allocation." - The Intelligence Council [19]
Another often-overlooked factor is power quality. Poor power quality - caused by issues like reactive power or harmonic distortion - can increase electricity costs by 5–30% [16]. In Mexico, for example, the Comisión Federal de Electricidad (CFE) may impose surcharges of up to 120% for poor power factors. Improving the power factor from 0.75 to 0.95 can reduce demand charges by 20–33% [16]. This is a significant saving that doesn’t require scaling back production - just better management of equipment and energy systems.
Just like real estate and labor, technology investments require a careful balance between fixed commitments and variable operational expenses. Fixed costs in technology include hardware, software licenses, and compliance audits, while variable costs cover items like cloud subscriptions, data usage charges, software updates, and periodic localization to meet regulatory changes. The key difference? Fixed costs are locked in upfront and remain constant, even if production slows down.
In some cases, operating in low-cost regions can lead to unexpectedly high expenses if local networks are unreliable. Businesses may need to invest in private backup power systems, dedicated fiber connections, or even on-site servers to ensure operational stability. These infrastructure challenges can cause costs to spiral if not managed carefully.
"A lower cost per square foot is quickly negated if the facility requires millions in backup generation [or data infrastructure]." - IndustryIDX [13]
Data regulations add another layer of complexity. For example, India's DPDP mandates compliance protocols that significantly increase costs. Initial compliance expenses can range from $8,500 to $32,000, with recurring audits and reporting adding to ongoing operational costs [14].
Automation has also reshaped how manufacturers evaluate locations. When automation reduces labor's contribution to total product costs from 40% to as low as 5% [1], factors like wage rates take a backseat. Instead, manufacturers focus on logistics access, reliable infrastructure, and the availability of skilled technicians to maintain advanced systems. This trend is clear: according to Deloitte's 2026 Manufacturing Outlook, 74% of manufacturers are reshoring or nearshoring operations [1], partly to gain tighter control over digital infrastructure and intellectual property protection.
"Poor infrastructure creates costs that offset wage advantages. Can the location support your technology requirements? Is power reliable? Are ports and airports accessible?" - Eric Pham, Founder & CEO, Rework [1]
To navigate these challenges, conduct a thorough digital audit. Evaluate fiber connectivity, power reliability, and IT support in potential locations. Treat data compliance as a fixed expense in your budget. For businesses operating in multiple regions, adopting a standardized Manufacturing Execution System (MES) can help maintain consistent quality across sites, reduce the impact of varying local skill levels, and streamline management [13]. Properly accounting for both fixed and variable technology costs is essential for effective cost planning in global operations.
Getting a handle on financing and taxes is critical when managing the costs of global manufacturing expansion. Both fixed and variable costs play a role, and their impact on your overall cost structure can be significant. For example, debt service payments are a fixed cost - they’re due every month, no matter if your new facility is running at 30% or 100% capacity. This can create cash flow challenges, especially during the early ramp-up phase when expenses often outpace revenue.
"Your debt service coverage ratio - the measure of whether your operating income covers your debt payments - can tighten significantly during a transition period when costs are running but revenue hasn't fully ramped." - Nauman Poonja, CEO, Accounovation [20]
A 13-week cash flow forecast can be a lifesaver here. This tool helps you map out the timing of expansion costs against the arrival of new revenue, giving you a clear picture of your financing needs. Before signing any debt agreements, it’s wise to stress-test your financial capacity, especially for demand fluctuations during the first 12 to 18 months. Once cash flow planning is in place, it’s time to dive into tax considerations.
Taxes bring their own mix of fixed and variable costs. For instance, setting up a foreign entity can cost anywhere from $20,000 to $150,000 per country, and maintaining compliance runs an additional $10,000 to $50,000 annually. On top of that, payroll taxes and benefits can add 20%–40% to base salaries [22]. The OECD's Pillar Two framework, now enforced in countries like Ireland, Indonesia, and Denmark, establishes a 15% global minimum corporate tax. If a subsidiary’s local tax rate is below this threshold, the difference must be paid elsewhere [22].
Tax incentives, however, can help ease these costs. For example, in April 2026, Samsung secured $4.7 billion in CHIPS Act funding to support its $17 billion semiconductor fab in Taylor, Texas [6]. Similarly, Georgia offered Rivian a $1.5 billion incentive package for its $5 billion EV plant in early 2026 [6]. These incentives often cover 10%–25% of project costs [6]. Domestically, U.S. tax law allows 100% bonus depreciation on capital equipment in the first year, and R&D expenses conducted within the U.S. are fully deductible immediately. However, overseas R&D costs must be spread out over 15 years [23].
"The ability to instantly write off R&D costs creates a significant, immediate cash flow advantage... bringing R&D back to the United States becomes an incredibly compelling proposition." - Adam Johnson, Partner and Executive Committee member, WebsterRogers, LLP [23]
For companies operating across multiple jurisdictions, transfer pricing is a critical compliance area. Intercompany transactions must follow arm’s-length pricing rules to meet IRS and foreign tax authority requirements. It’s essential to document your transfer pricing strategy promptly - for example, Canada now requires this documentation within 30 days [22]. Tax authorities worldwide are tightening their timelines, so staying ahead is key. Firms like Phoenix Strategy Group (https://phoenixstrategy.group) specialize in helping growth-stage manufacturers model tax scenarios and develop the financial systems needed to maintain compliance across borders.
With a solid financing and tax strategy in place, you’ll be better prepared to tackle the next challenge: risk buffers and contingencies.
When it comes to global manufacturing expansion, costs often spiral beyond initial estimates - sometimes by as much as 30% to 50% [21]. However, with the right planning tools, up to 80% of these overruns can be avoided [6]. The secret lies in treating risk not as a surprise but as an expected part of the process, built into the budget from the start.
"Volatility is no longer treated as an outlier event. It is assumed." - Global Trade Magazine [24]
Savvy teams allocate at least 10% to 15% of total project costs to cover permitting delays and unforeseen hurdles [6]. Beyond this baseline, specific financial reserves should address three key risk areas: currency fluctuations, supply disruptions, and regulatory changes. Each of these requires a tailored approach to minimize exposure.
Currency risks can hit manufacturers in three ways: transaction risk (losses from delays in cross-border payments), translation risk (converting foreign financials back to U.S. dollars), and economic risk (long-term competitiveness affected by exchange rates) [22]. Even seemingly minor costs, like foreign exchange (FX) transaction fees, can add 1% to 3% to cross-border operations [22]. To mitigate these risks, companies can utilize multi-currency accounts, forward contracts, or currency swaps to lock in favorable rates [22]. In fact, the use of FX derivatives rose 20% in 2025 as more businesses prioritized hedging [22]. This proactive strategy complements broader cost management efforts across labor, supply chain, and technology investments.
Supply chain disruptions can be incredibly expensive. A six-week supplier failure, for example, could jeopardize key customer relationships [25]. To counter this, manufacturers should dual-source critical components and conduct SKU-level total cost of ownership (TCO) audits to identify vulnerabilities related to tariffs, labor, and intellectual property [7]. Take Gotion as an example: in 2025, the EV battery manufacturer invested $1.3 billion in a factory in Morocco, strategically positioning itself in a trade-friendly region to avoid overexposure to tariff-heavy markets [2]. This approach not only cushions against supply chain risks but also highlights the importance of balancing fixed and variable costs when planning for expansion.
"The goal isn't to eliminate risk, because that's unrealistic, but to avoid being overexposed to any single policy or geography." - Global Trade Magazine [24]
Regulatory risks are often underestimated but can have a huge impact. Steps like pre-registering intellectual property (IP) to prevent trademark squatting and defining clear exit strategies for underperforming markets are crucial [21]. These buffers, alongside a focused approach to managing costs, are essential for building a resilient global expansion plan.
To fully grasp the financial implications of global expansion, it’s essential to examine all seven cost factors together. This fixed-versus-variable framework provides a consolidated view of these elements, offering a clearer perspective on Total Cost of Ownership (TCO).
| Cost Factor | Primary Nature | Key Dynamic |
|---|---|---|
| Real Estate & Capital Equipment | Fixed | High upfront CAPEX requiring long-term regional stability to break even |
| Labor & Workforce | Variable → Fixed | Automation converts labor costs into fixed capital investments |
| Supply Chain & Logistics | Variable | Long distances can erase wage savings due to higher inventory and transit costs |
| Energy & Utilities | Variable | Rising energy prices and tariffs demand factory-level operational adjustments |
| Technology & Digital Infrastructure | Fixed | Substantial initial costs to bridge the gap between high- and low-wage countries |
| Financing & Taxes | Variable | Tariffs of 10%–25% can eliminate the cost advantage of low-cost manufacturing [2] |
| Risk Buffers & Contingencies | Fixed | Dual-sourcing increases fixed costs but mitigates risks of operational disruptions |
The table underscores a critical point: focusing on a single cost factor in isolation can lead to flawed decision-making. A holistic TCO approach is vital to understanding how these elements interact. For instance, while labor costs in Southeast Asia might seem attractive, hidden costs like logistics and inventory can negate those savings, ultimately driving up the total delivered cost [1].
"Comprehensive cost analysis prevents optimizing one element while sub-optimizing total cost." - Eric Pham, Founder & CEO, Rework [1]
TCO modeling goes beyond surface-level analysis. It factors in labor, materials, utilities, overhead, logistics, and quality rework, while also stress-testing scenarios such as tariff increases or currency shifts. This detailed approach reveals the true cost efficiency of a manufacturing strategy. By 2026, 74% of manufacturers are reshoring or nearshoring because TCO analysis has shown that distant low-cost sites often aren’t as economical as they initially seem [1].
With the support of Phoenix Strategy Group, this real-time financial modeling allows manufacturers to adapt their network strategies and manage cost changes as production volumes or trade conditions evolve.
Expanding manufacturing operations globally isn't just about finding cheaper labor. The process is far more intricate, as highlighted by the seven cost factors. For instance, hidden costs can inflate an expansion budget by 40% to 60% [26], while tariffs exceeding 25% can completely negate the cost benefits that initially made a location appealing [2].
Savvy manufacturers today aren't merely chasing the lowest production costs. Instead, they're creating detailed financial models that factor in everything - energy price fluctuations, digital infrastructure needs, risk mitigation strategies, and financing options. As Daniel Kuepper from BCG explains:
"Manufacturers must build stronger scenario-planning capabilities that allow them to weigh quantitative and qualitative criteria carefully across a range of potential future conditions." [2]
This level of meticulous, data-driven preparation is what distinguishes successful expansions from costly mistakes. It involves stress-testing assumptions about currency fluctuations, tariff adjustments, and supply chain disruptions well before committing resources.
If your business is planning a global expansion and requires precise cost modeling, Phoenix Strategy Group can provide the expertise you need. Their services - ranging from FP&A and cash flow forecasting to M&A advisory - offer the financial insights necessary to expand across borders with confidence.
When companies expand manufacturing operations globally, several hidden costs can sneak up and disrupt budgets if not carefully planned for. These include:
Each of these factors can have a big impact on financial planning, making it crucial to evaluate them thoroughly during the early stages of expansion.
To figure out the total cost of ownership (TCO) across different countries, you need to consider both direct and indirect costs. This includes factors like logistics, tariffs, labor expenses, energy prices, and risks tied to the supply chain.
Using tools to compare domestic and offshore options can help you weigh these costs effectively. Don’t forget to factor in trade policies and geopolitical risks, as they can significantly impact the overall cost. Scenario planning, along with integrated data systems, can make your analysis more precise - giving you the insights needed to choose the best manufacturing location.
Nearshoring tends to be more cost-effective than offshoring when the landed cost advantage falls within a range of 15–30%. This is largely due to factors like shorter shipping routes, lower tariffs, and decreased inventory expenses. These elements combine to make nearshoring a smart financial choice in many situations.