Published on
July 12, 2026


A credit selloff does not always mean the business is broken. In many cases, price drops come from forced selling, thin liquidity, weak reporting, or legal noise instead of a lasting loss in value.
Here’s the short version:
A few numbers from the article make the point fast:
What I take from this is simple: price can reflect urgency, not value. If you want to judge a stressed borrower well, you need to separate market pressure from credit loss.
That is the lens for the rest of the piece.
Stressed prices can drop far below recovery value because the market often prices urgency, not business worth. In rough periods, the trading price of a credit instrument can tell you more about who needs to sell right now than about what the business is worth over time.
One big driver is liquidity mismatch. If a fund offers investor withdrawals but holds assets that don't trade much, redemption requests can push prices down fast. Managers may need to sell into a thin market, and that can lead to distressed prices even when expected recovery value is higher.
That tension showed up in early 2026, when Morgan Stanley's North Haven Private Income Fund returned only $169 million to investors - 45.8% of total tender requests - so it could remain within its 5% redemption cap [2].
And that's the point: a low trade doesn't always mean the asset is broken. Sometimes it means the holder needs cash and doesn't have many easy options.
Liquidity pressure is only part of the story. Bad or delayed disclosure can make things worse.
After a credit event, investors often have to stitch the story together from filings and court documents. Markets don't wait for that process to finish. Prices can move long before the facts are clear.
When disclosure is thin, investors often assume the worst-case scenario. That can push prices below what later turns out to be fair value. It can also lead lenders to tighten terms before actual losses show up.
This gets more serious in concentrated sectors. Software makes up about 20% of the U.S. direct-lending market, and as much as 30% to 35% if you include adjacent industries [1]. So if one stressed borrower in that pocket runs into trouble, weak information can cause investors to mark down the whole segment as if the issue is broad-based.
Once uncertainty spreads, fund rules and legal friction can push prices down even more.
Some sell-offs happen because investors or funds have to act, not because they believe every asset is impaired. Redemption caps are supposed to stop managers from dumping assets into a bad market. But when withdrawal requests get too large, those same limits can still lead to gates or sales at distressed levels [2].
In that kind of setup, the market price may reflect a need for liquidity, not a clean read on credit quality.
Legal structure matters too. In some instruments, including venture debt, covenant traps can turn delays into technical defaults even when enterprise value is still there [3]. That's why legal work isn't just a side issue. It's part of figuring out whether a low price reflects panic, paperwork, or permanent damage.
To make that call, you have to separate trading pressure from actual credit loss. That means looking at:
At bottom, the question is simple: does the issuer still have the cash, collateral, and legal room to recover?
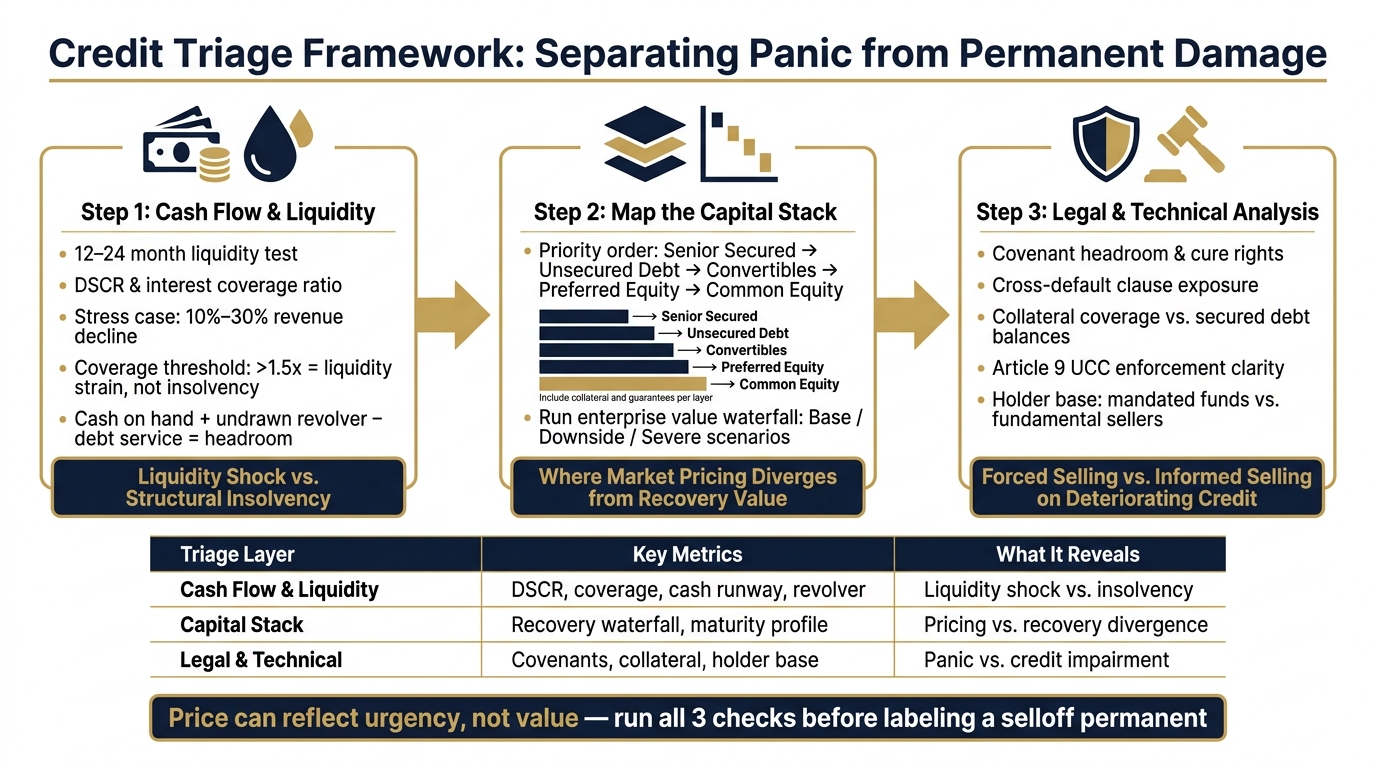
Credit Triage Framework: 3 Steps to Separate Panic from Permanent Damage
Three checks help separate panic from actual damage: liquidity, recovery value, and legal constraint. Each one ties back to the pressures already on the table - market stress, thin disclosure, and forced selling. Put together, they give you a simple way to tell a short-term dislocation from lasting credit impairment.
Start with a 12- to 24-month liquidity test. Look at EBITDA versus cash interest and scheduled debt service under a stress case. If coverage stays above 1.5x under stress, that often points to liquidity strain rather than insolvency.
Then test liquidity headroom. Add cash on hand to undrawn revolver capacity, then subtract expected cash burn and mandatory debt service. Use a stress case with a 10% to 30% revenue decline, some margin pressure, and tighter customer payment terms. If the business can get through that period with existing resources and modest cuts, the credit event may be creating a discount that says more about fear than long-term value.
Once you've checked cash flow, map the full capital structure in priority order: senior secured debt, unsecured debt, convertibles, preferred equity, and common equity. Include the collateral and guarantees tied to each layer.
Next, estimate enterprise value under base, downside, and severe cases. Then run a waterfall and allocate value through the stack from top to bottom. This is where things get interesting. A waterfall can show that market pricing and recovery value aren't lining up. And when those two drift apart, that's often where mispricing shows up.
Now filter for legal and technical risks. Check whether covenants, cross-defaults, or weak collateral are causing the price gap. Tight covenants with no cure rights can set off default triggers even when the company is still cash-flow positive [4][5]. Cross-default clauses can then drag multiple facilities into acceleration at the same time, shrinking the window for any workout.
Strong collateral coverage can point in the other direction. If appraised collateral value sits well above secured debt balances and enforcement paths are clear - such as under Article 9 of the UCC - a sharp drop in price is more likely tied to forced selling than actual recovery risk [4][6].
The holder base matters too. Sharp price gaps around ratings downgrades or index rebalances, especially in fund groups with tight mandates, often look more like technical dislocation than informed selling based on weaker fundamentals.
| Triage Layer | Key Metrics | What It Reveals |
|---|---|---|
| Cash Flow & Liquidity | DSCR, interest coverage, cash runway, revolver availability | Liquidity shock vs. structural insolvency |
| Capital Stack | Recovery waterfall by tranche, debt maturity profile | Where market pricing diverges from recovery value |
| Legal & Technical | Covenant headroom, collateral coverage, holder base | Forced selling vs. informed selling on deteriorating credit |
Once the discount is tied to panic, the next issue is how management can shrink it.
Investors can spot the triage from the outside. Management has more control from the inside than it may seem. If the discount is coming from panic rather than lasting damage, one of the best ways to shrink it is to tighten reporting before stress shows up.
When financials show up late or cash balances don’t tie out cleanly, lenders tend to assume the worst. And when they’re missing clear data, they usually plug that hole with a higher risk premium.
The fastest fixes are pretty simple: a dependable cash forecast and a covenant view that changes as the business changes.
A weekly 13-week cash flow forecast should lay out receipts, payroll, debt service, taxes, revolver use, and ending liquidity. It should also be updated every week and tied back to actual bank data.[7][8][10]
A simple covenant dashboard can help management stay ahead of trouble. It maps each lender covenant, like leverage ratio, interest coverage, and minimum liquidity, against current and projected performance. It also flags pressure points and shows what actions management can take to close the gap. Downside plans matter here. When management has already worked through what happens in a bad case, lenders have less reason to mark risk out of fear.
Monthly GAAP-compliant statements delivered within 10–15 business days after month-end can also ease spread pressure during a stress period.[9][11] Pair those statements with a short variance note that explains what changed and why. That context matters. A one-time customer loss or supply shock reads very differently when management spells it out clearly instead of leaving lenders to guess after an unexplained revenue miss.

Putting these controls in place takes clean books, disciplined FP&A, and steady reporting.
Phoenix Strategy Group helps growth-stage companies build that system. Their bookkeeping services set up clean transaction-level data, proper accruals, and reconciled ledgers. Through fractional CFO services, Phoenix supports cash management, covenant design, and capital structure choices. On the FP&A side, they build integrated financial models, 13-week cash flow forecasts, and scenario analysis so management can walk into a refinancing with a clear answer to the questions creditors care about most.
Their data engineering work builds automated dashboards that give real-time visibility into operating drivers, closing the gaps that can turn a setback into a panic discount. For companies heading toward a transaction, Phoenix also supports transaction readiness by organizing data rooms, cleaning up historical financials, and lining up the credit story so counterparties can size up risk faster, even in volatile markets.
Clear reporting narrows the discount.
Credit events can throw prices badly out of line when liquidity dries up, disclosure runs behind reality, forced sellers take over, and legal terms haven't been sorted out yet. In March 2020, distressed bond trades in corporate bonds rose five-fold, and credit spreads moved to about 300 basis points over Treasuries [14][12][13]. Then the Federal Reserve announced the PMCCF and SMCCF on March 23. Before major buying even got underway, eligible investment-grade spreads tightened by about 100 basis points [15][16]. That's mispricing. It isn't automatic proof of permanent damage.
But panic and impairment aren't the same thing.
Permanent impairment tends to show up in harder signals: cash burn starts climbing, maturities stack up in a short window, covenant breaches look more likely, and refinancing isn't available on terms a company can live with. Capital structure plays a big part too. Two companies can post similar operating results and still trade in very different ways if one has a clean debt setup and the other is weighed down by layered liens, clashing creditor rights, or murky default definitions.
That's where things can get messy fast. If cure periods, acceleration rights, collateral packages, or intercreditor terms are unclear, investors often price in the worst-case recovery before the facts are settled. It's a bit like seeing smoke and assuming the whole house is gone.
So the test is pretty simple. Before labeling a selloff as permanent, check:
For operators, the best defense is better information before stress shows up. Phoenix Strategy Group works with growth-stage companies to tighten bookkeeping, forecasting, FP&A, and reporting so creditors get cleaner data when markets turn shaky. In a credit squeeze, clean reporting can narrow the panic discount.
Look past market mood and focus on the issuer’s financial health. Panic selling often comes from fear and herd behavior, which can shove prices below their actual worth when markets get shaky.
Real credit damage shows up in the numbers. Watch for a weaker current ratio, falling profit margins, or a debt-to-equity ratio the business can’t support. These signs help you tell the difference between a price drop driven by default risk and one caused by short-term mispricing.
Signs of a liquidity problem, rather than insolvency, often include a current ratio below 1.0 and short-term cash crunches tied to seasonal swings or delayed customer payments.
Unlike insolvent firms, these businesses may still have steady operations. The issue is often timing. Cash isn’t coming in when it’s needed.
Common signs include aging receivables, payment-processing barriers, and inventory that should eventually turn into cash.
They matter because market stress can turn into a survival problem fast. Covenants put guardrails on performance and limit what a company can do. If a company gets close to a breach, it can trip a technical default and lose leverage in talks with lenders.
Cross-defaults make the situation worse by letting one breach spill into other debt agreements. That can squeeze liquidity or force a fire sale, which often adds to panic and short-term mispricing.