Published on
June 24, 2026

If I had to boil this down to one point: a green hydrogen model only works if it ties plant output, power cost, tax credits, debt service, and return tests into one clear view. If I miss even one of those pieces, the model can look fine on paper and still fail under lender or investor review.
Here’s the short version of what matters most:
A simple example shows why this matters. A 10 MW electrolyzer at a 70% capacity factor uses about 61,320 MWh/year. At 55 kWh/kg, that works out to about 1.1 million kg/year of hydrogen. And at $50/MWh, power cost alone is about $2.75/kg. That’s before labor, water, maintenance, debt, and taxes.
So when I build or review this kind of model, I’m not just asking, “What does the project produce?” I’m asking, “Can it pay its bills, meet debt terms, and still earn enough return under hard cases?”
The rest of the guide walks through that process in a simple order: scope, output, power, revenue, incentives, costs, financing, and return tests.
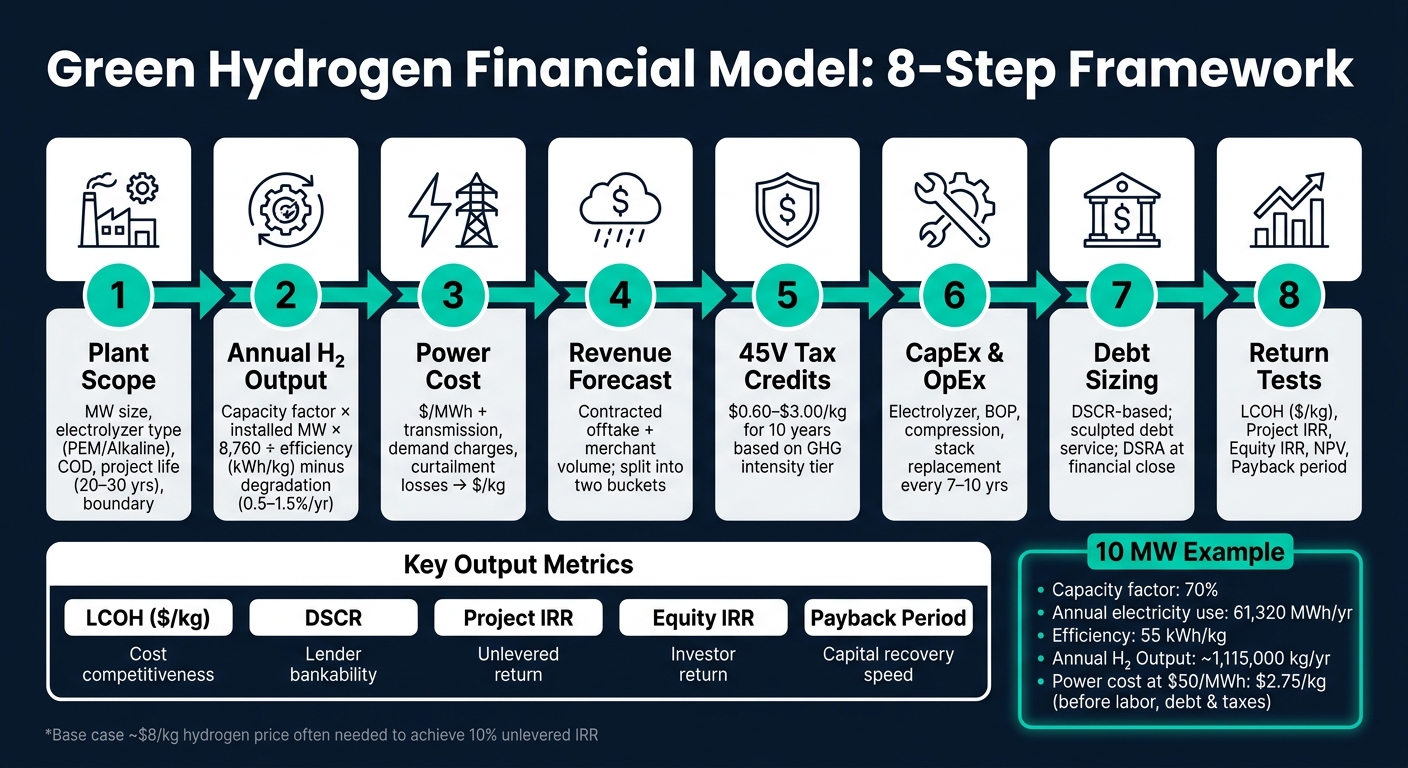
Green Hydrogen Financial Model: 8-Step Framework
Before you put a single number into a spreadsheet, get clear on the decision the model needs to support. The core question is simple: can the project cover capex and opex, service debt, and still deliver an acceptable return across pricing and offtake cases? Once those tests are clear, you can set the project boundary and build the workbook around them.
Different stakeholders care about different outputs. Lenders zero in on DSCR to check whether the project can meet debt payments. Equity investors and management look at IRR and NPV to see if the return is worth the capital at risk. And LCOH gives everyone a common cost benchmark, which makes it easier to compare the project with other technologies and locations [1].
Use these metrics to shape the model’s outputs:
| Metric | Primary Audience | What It Answers |
|---|---|---|
| LCOH ($/kg) | All stakeholders | Is this project cost-competitive? |
| DSCR | Lenders / banks | Can the project service its debt? |
| IRR / NPV | Investors / management | Does the return justify the investment? |
| Payback period | Management | How fast does the project recover capital? |
These metrics set the model’s main pass-fail checks.
The model boundary determines what the numbers actually cover. At a minimum, spell out the installed electrolyzer capacity in MW, the electrolyzer technology, such as PEM or alkaline, the expected hydrogen output in kg/day or kg/year, and the commercial operation date, or COD. Project life usually runs 20–30 years, and that one assumption shapes the full cash flow timeline [1].
You also need to decide what sits inside the model boundary. Does the project include owned renewable generation, compression, storage, or transport? Those choices change output, capex, opex, and the power sourcing setup in a big way. A project that owns its solar or wind assets will have a very different capex profile from a standalone plant that buys power through a PPA. Including the full value chain - water treatment, compression, civil works, and grid interconnection - helps make sure no major cost bucket is missed [1].
Once that boundary is fixed, the operating model can turn installed capacity into hydrogen output and power demand.
A clean workbook structure makes the model easier to audit and easier to trust. Separate the file into tabs for inputs, operations, revenue, costs, financing, taxes, and outputs. Keep all hard-coded assumptions on the inputs tab so every result can be traced back to a source [1].
With the workbook set up, the next job is turning plant specs into two things: hydrogen output and electricity cost. In plain terms, the model needs to convert nameplate specs into annual production before it can attach a power bill.
Start with the core math.
Annual electricity use = installed MW × 8,760 × capacity factor.
Annual hydrogen output is that electricity use divided by the electrolyzer's specific energy consumption in kWh/kg[1].
Here’s a simple example. A 10 MW PEM electrolyzer running at a 70% capacity factor uses about 61,320 MWh per year. If the system consumes 55 kWh/kg, it produces about 1,115,000 kg of hydrogen per year[1].
That headline number can slip over time for two quiet reasons.
You’ll also want to treat stack replacement every 7–10 years as its own capex event[5][2]. If the project uses solar or wind, don’t lean on a flat annual capacity factor alone. Use hourly resource data instead, because intermittency can change actual output far more than an annual average suggests[4].
Once output is in place, price the electricity behind it. This part matters a lot because power cost often drives the economics of the whole project.
Power cost per kg = electricity price per MWh ÷ 1,000 × kWh/kg[1]
At $50/MWh and 55 kWh/kg, power alone comes to $2.75/kg.
That’s the easy part. The model also needs to include more than the posted $/MWh number, especially when the project uses grid power. In practice, that means adding transmission charges, demand charges, curtailment losses, and imbalance costs[1].
| Power Supply Option | Cost Stability | Complexity | Clean hydrogen compliance risk |
|---|---|---|---|
| On-site Renewables | High (fixed capex) | High (siting, sizing, generation model) | Low (direct physical link) |
| PPA (off-site) | Medium (contracted rate) | Medium (legal, sleeving, matching) | Medium (requires RECs and matching) |
| Grid Supply | Low (market volatility) | Low (standard utility connection) | High (requires strict hourly matching) |
With output and power cost locked in, the model is ready for revenue and incentive inputs.
Once net output is set, turn kilograms into revenue. Use saleable volume after downtime and degradation, not gross output.
This is where deal structure starts to matter a lot. Long-term offtake agreements often come with indexed pricing or built-in escalators. Merchant sales, by contrast, depend on spot prices and can swing much more from year to year.
A simple way to keep the model honest is to split volume into contracted and merchant buckets. That lets you stress each one on its own instead of blending them together and hiding the risk.
Put policy support on top of hydrogen sales, because tax credits can change project economics in a big way.
The Section 45V clean hydrogen production tax credit gives projects a 10-year incentive window and pays between $0.60/kg and $3.00/kg of hydrogen produced, based on lifecycle greenhouse gas intensity [9].
| GHG Intensity (kg CO₂e/kg H₂) | 45V Credit Rate (per kg H₂) |
|---|---|
| 0.00 – 0.44 | $3.00 |
| 0.45 – 1.49 | $1.00 |
| 1.50 – 2.49 | $0.75 |
| 2.50 – 3.99 | $0.60 |
Rates assume prevailing wage and apprenticeship requirements are met. Without those requirements, credits fall to 20% of these rates [9].
When you model 45V, tie it to emissions intensity, eligible clean power sourcing, and the 2030 move to hourly matching. That shift can push certificate costs up and shrink net credit value [8][9].
For timing, model years 1–5 as direct pay and years 6–10 as transferable credits sold at a discount [10].
After hydrogen sales and tax credits, be picky about any extra revenue. Only include ancillary income the project can actually capture with some confidence. Oxygen revenue should go in ONLY if it is contracted or clearly demonstrable, and even then, stress it down hard [7].
| Revenue/Incentive Stream | Stability | Duration | Modeling Risk |
|---|---|---|---|
| Hydrogen Sales | Variable (Merchant) to High (Offtake) | 10–20 years | Market price volatility and offtaker credit risk |
| 45V Tax Credits | High (Federal law) | 10 years | Regulatory compliance |
| Oxygen Byproduct | Low to Moderate | Project life | Local industrial demand |
| State Programs | Moderate | Varies by state | Policy shifts or expiration of state-level caps |
Once revenue is set, the next job is building the cost stack and capital structure that convert project output into cash flow.
Start by splitting capex into clear buckets: electrolyzer system, balance of plant, compression and storage, water treatment, interconnection, civil works, and EPC.
On the operating side, separate costs into fixed and variable buckets. Fixed costs cover labor, insurance, land lease, property taxes, project company fees, and routine maintenance. Variable costs are led by electricity, with water, consumables, and transport filling out the rest [1].
One point that’s easy to miss: stack replacement shouldn’t sit in steady annual OpEx. Treat it as a discrete capital event [1][2].
| Cost Category | Key Components | Impact on LCOH |
|---|---|---|
| CapEx | Electrolyzer stack, balance of plant, compression, storage, water treatment, civil works, grid interconnection, EPC | High (upfront) |
| Fixed OpEx | Labor, insurance, land lease, property taxes, project company fees, routine maintenance | Moderate |
| Variable OpEx | Electricity (PPA/Grid), water, consumables, transport | Very high |
| Financing/Other | Debt interest, stack replacements, decommissioning reserves, DSRA | Moderate |
For green hydrogen projects, debt sizing is often DSCR-based. In plain terms, lenders usually start with DSCR as the main sizing test, then look at repayment shapes like level debt service, equal principal, and sculpted debt cases [5]. Sculpted debt can be especially helpful because repayments track more closely with the project’s cash flow pattern [5].
Equity should be modeled as phased contributions so the Uses of Funds table stays balanced [2].
For depreciation and taxes, include income taxes, 45V tax credits, and MACRS or other accelerated depreciation methods. That gives you a clear view of the after-tax effect on returns [2][5].
Also include the DSRA in sources and uses at financial close. It’s a cash outflow, and it lowers the equity required upfront [5]. These inputs then flow into the return tests in the next section.
Now put the revenue, cost, and debt outputs from the prior sections to work. The point here is simple: check whether the project clears return targets and debt tests. These metrics should tie straight back to power cost, utilization, capex, incentives, and debt assumptions.
LCOH measures discounted life-cycle cost divided by discounted hydrogen output, in $/kg. In practice, LCOH should be at or below the expected offtake price, including eligible subsidies such as 45V [1][3].
Project IRR shows the unlevered return on the project. Equity IRR shows the return to investors after debt service. As a rule of thumb, a base case hydrogen price around $8/kg is often needed to hit a 10% unlevered return [1][6]. NPV discounts free cash flow over a 20- to 30-year project life using your selected discount rate, and investors and lenders use it to screen project proposals [1]. Report minimum and average DSCR as the main bankability check [1][5]. Also track the equity payback period, which is the time needed to recover the initial investment [5].
| Metric | What It Measures | Key Drivers |
|---|---|---|
| LCOH ($/kg) | Discounted cost per kg of H2 | Electricity price, capex, utilization, efficiency [1][6] |
| Project IRR | Unlevered return on investment | Revenue, opex, capex [6] |
| Equity IRR | Return to shareholders after debt service | Interest rates, leverage ratio, DSCR [1][5] |
| NPV | Present value of future cash flows | Discount rate (WACC), terminal value [1][5] |
| DSCR | Ability to service debt | Cash flow from operations, interest, principal [1][5] |
A good model doesn’t treat these as stand-alone outputs. If electricity cost moves, LCOH changes. If utilization slips, IRR and DSCR can fall fast. If 45V treatment changes, the whole return picture can shift.
A single-point forecast can look neat on paper and still miss the risk that matters. Before any capital commitment, stress-test the assumptions that hit the model hardest: electricity price, utilization, efficiency, capex, hydrogen price, and 45V eligibility [1][3].
Tornado diagrams in Excel are a practical way to rank variables by their effect on LCOH or IRR [1]. In many cases, electricity price is the biggest opex driver, so the model should test different power supply setups, including on-site solar, wind, grid supply, or blended sources [1][2]. It also helps to run simple what-if cases, such as a 20% drop in electricity prices and a 15% rise in capex, to see how far the outputs move [1]. Utilization matters just as much. If the project leans on intermittent renewables without grid support or storage, lower run rates can weaken the economics in a big way [6].
You should also test 45V eligibility tiers as a separate scenario [3]. If tax credit treatment changes, model that case on its own and check whether DSCR still clears lender thresholds.
Once the base case is in place, pressure-test the assumptions that drive the results most.
| Scenario | Key Assumptions | Decision Question |
|---|---|---|
| Base case | Current assumptions for power, utilization, capex, pricing, and tax credits | Does the project meet your target return and debt metrics? |
| Downside | Higher power costs, lower utilization, higher capex, weaker pricing, or reduced tax credits | Does the project remain financeable? |
| Upside | Lower power costs, stronger offtake pricing, higher utilization, or better tax credit capture | How much cushion does the project have? |
Use the downside case to confirm that the project still clears lender and investor thresholds.
The most important assumptions fall into three buckets: technical, economic, and policy drivers.
On the technical side, the key inputs are electrolyzer capacity, efficiency in kWh/kg, degradation, and annual capacity factor. These shape how much hydrogen the project can produce and how well the system performs over time.
On the economic side, power cost is usually the biggest operating expense. That’s why electricity pricing and sourcing matter more than almost anything else. If the power price is off, the whole model can shift fast.
Revenue assumptions should also cover offtake pricing, along with any subsidies or tax incentives. And then there’s the financing piece: CapEx and the debt-equity structure play a big role in whether the project makes sense on paper and in practice.
The 45V tax credit can materially improve project returns because it offers a production tax credit of $0.60/kg to $3.00/kg of hydrogen, based on lifecycle greenhouse gas emissions.
To get the full value into the model, include the three-pillar rules, carbon intensity under the 45VH2-GREET model, and the credit’s 10-year term. The model should also account for direct pay and transferability.
A green hydrogen project is financeable when it can pay for upfront build costs, day-to-day operating expenses, debt payments, and still leave room for investor returns across different market conditions.
What does that look like in practice? It usually comes down to a few core pieces: long-term off-take agreements, healthy debt service coverage ratios, workable repayment timelines, solid risk mitigation, and tax credits or subsidies that help close the cost gap.