Published on
September 14, 2025

Cash flow dashboards simplify managing revenue in project-based businesses by providing real-time financial insights. These tools consolidate data from accounting and project management systems to offer a clear picture of cash flow, overdue invoices, and project profitability. This visibility helps businesses forecast revenue, manage irregular payment cycles, and make informed decisions about expenses, hiring, and growth.
Without dashboards, managing revenue involves time-consuming manual processes, outdated data, and missed trends that can harm cash flow and decision-making. Dashboards address these issues, making them a valuable tool for professional services firms looking to improve financial clarity and stability.
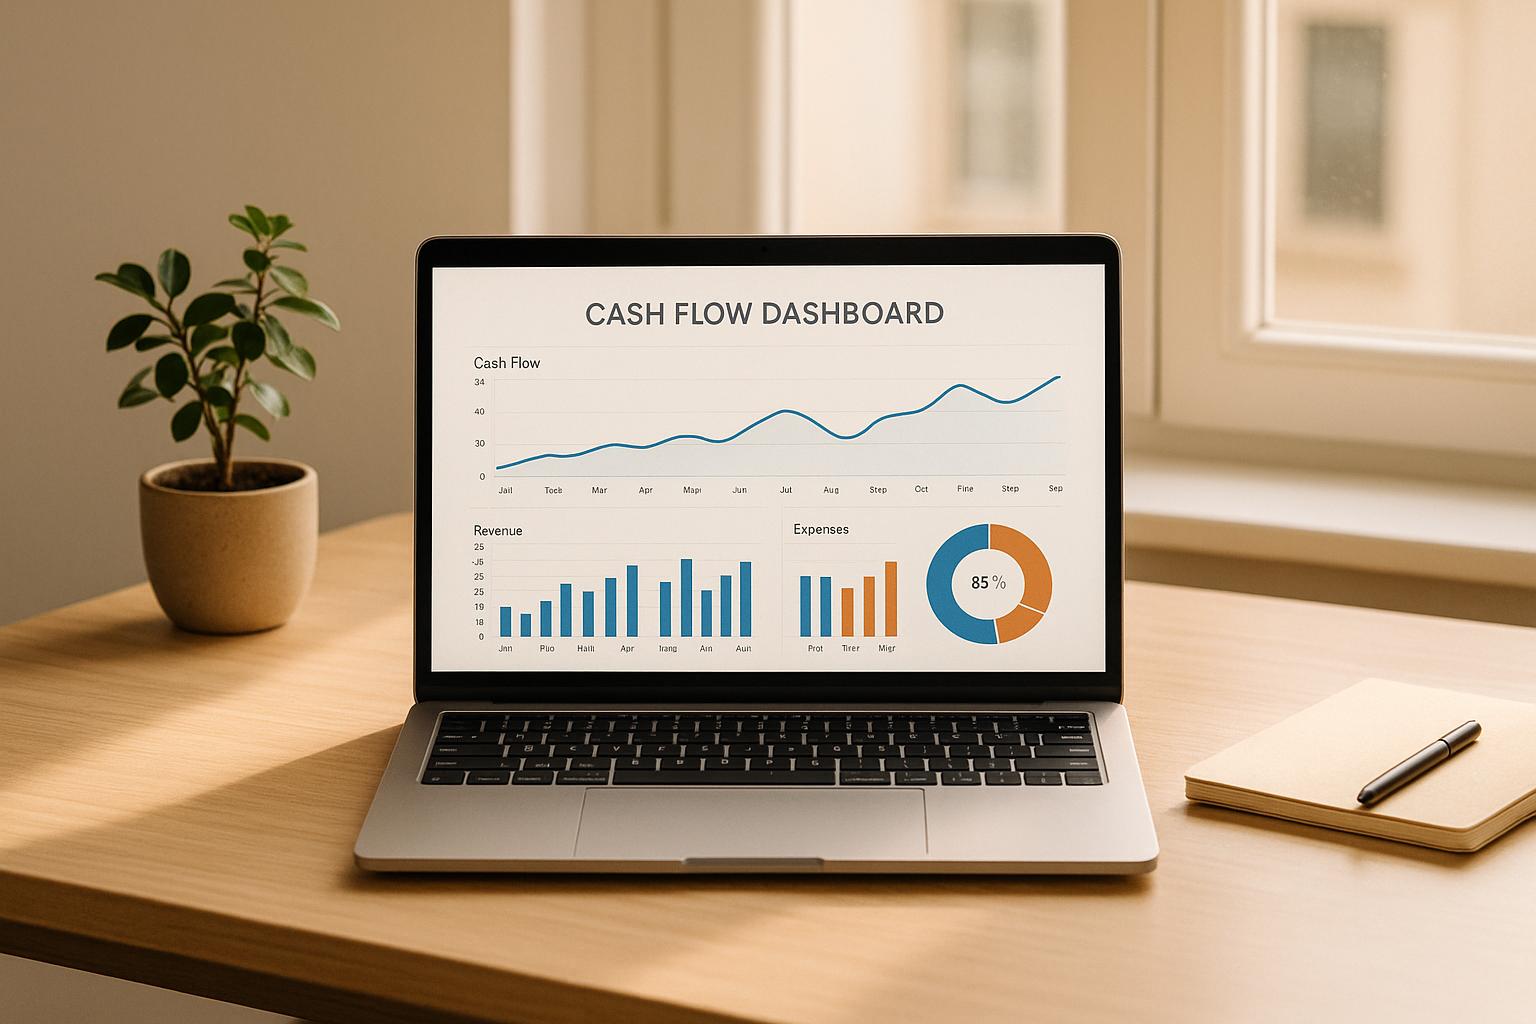
A cash flow dashboard is a digital tool that brings all your financial data together in one place, presenting it in real-time through easy-to-understand visuals. By pulling information from spreadsheets, accounting software, and project management tools, it provides a single, up-to-date view of your financial health. This integration eliminates the hassle of juggling multiple systems and ensures everything stays in sync.
These dashboards work by connecting to your core financial and project management systems. Once linked, they automatically update whenever there’s a new transaction, a paid invoice, or a completed project milestone. Instead of sifting through raw data, you’re presented with clear visuals - charts, gauges, and alerts - that highlight key trends like cash flow, liquidity, and overdue payments.
For professional services firms, this real-time insight is especially important. Project revenue can be unpredictable, with large invoices due in one period and delays in client payments in another, all while fixed costs like payroll keep rolling in. Without a dashboard, managing these fluctuations becomes a guessing game, leaving you without a clear financial picture.
Cash flow dashboards are designed with project-based revenue in mind, offering features that address its unique challenges. Here’s what they bring to the table:
These features aren’t just convenient - they address the inefficiencies of manual data management and help you avoid the risks of delayed insights.
Managing project revenue the old-fashioned way comes with its own set of headaches. Manually compiling data from multiple sources is not only time-consuming but also prone to errors. Finance teams often spend hours pulling reports and merging information into spreadsheets, which can lead to outdated or incomplete data.
In project-based work, delayed milestone payments are common. Without real-time visibility, you could find yourself scrambling to cover payroll or vendor costs before realizing there’s a cash flow issue. This reactive approach can disrupt operations and strain relationships with employees or suppliers.
Another challenge is inconsistent reporting across projects, which makes it hard to spot trends or make informed decisions. When stakeholders - like project managers or sales teams - don’t have access to comprehensive financial data, critical issues may go unnoticed until it’s too late.
Lastly, poor cash flow forecasting can hold your business back. Uncertainty about future cash inflows might make you hesitant to invest in growth opportunities or take on new projects, ultimately creating unnecessary limits on your potential.
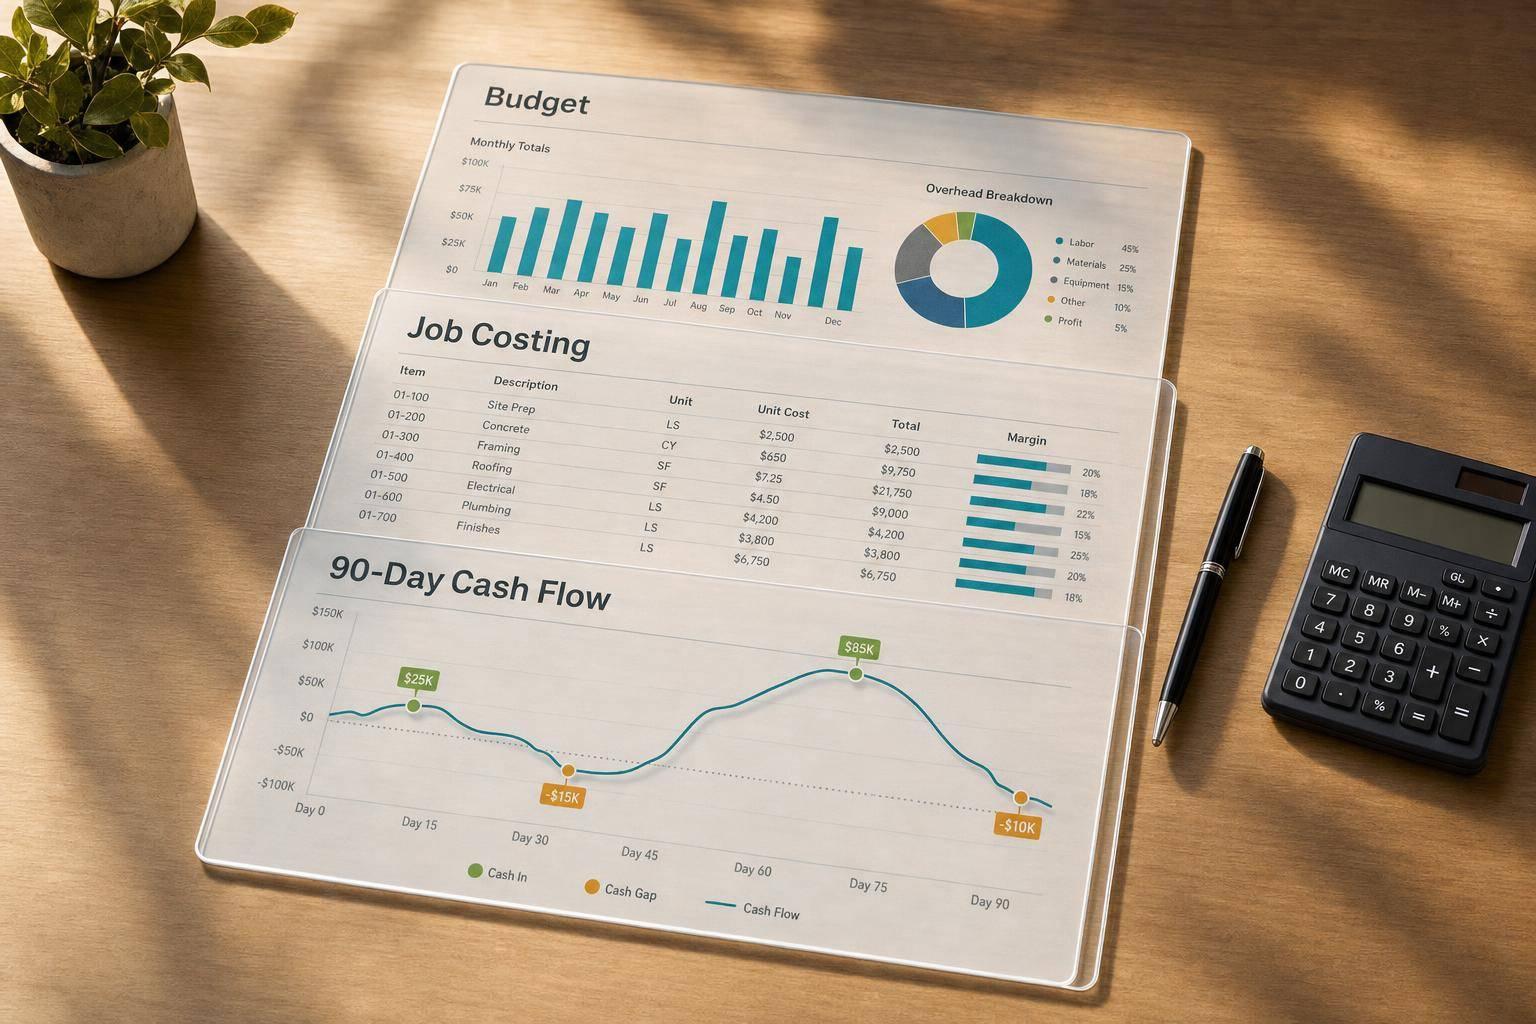
Managing project revenue effectively starts with keeping a close eye on the right financial metrics. Cash flow dashboards are powerful tools for monitoring these indicators, offering professional services firms the clarity they need to make smart decisions. When tracked in real time, these metrics allow firms to adjust project strategies and maintain financial stability. Let’s dive into the critical metrics, starting with those that measure liquidity and immediate operating capacity.
Cash on hand represents the funds you have available right now for essential expenses like payroll, rent, and vendor payments. Unlike revenue that exists only on paper, this metric highlights what you can actually spend today.
Liquidity tracking goes beyond cash on hand to include savings, money market accounts, and short-term investments that can be quickly converted into cash. This broader perspective reveals your financial flexibility, especially when unexpected costs arise or project payments are delayed.
One key measure, days cash on hand, shows how long your current reserves will last based on average daily operating expenses. For example, if you have $450,000 in liquid assets and daily expenses of $15,000, you’ve got 30 days of operational cash. This metric is crucial for navigating seasonal dips or slowdowns in new project starts.
Many firms aim for a cash reserve covering 60-90 days of operating expenses. This cushion can ease the stress of client payment delays and give you the confidence to pursue new opportunities without worrying about short-term cash flow issues.
Keeping tabs on receivables is essential for understanding your cash flow health.
By tracking these receivables metrics, you can spot potential collection problems early, prioritize follow-ups, and make informed decisions about extending credit to clients.
For a deeper understanding of profitability, it’s also important to analyze project-specific revenue metrics.
To identify which projects and clients are driving your profitability, focus on the following metrics:
Once you've pinpointed the key metrics, the next step is weaving cash flow dashboards into your daily operations. The magic happens when you set them up correctly, integrate data seamlessly, and monitor them consistently. This process transforms raw numbers into meaningful insights that drive decision-making.
Start by tailoring dashboards to meet the needs of specific roles - project managers, CFOs, and account executives should each see the metrics that matter most to their responsibilities. Use color coding and threshold-based alerts to spotlight critical metrics and prompt timely actions.
For example, you can set up alerts to notify team members when cash reserves fall below a certain level or when a project's profit margin dips below an acceptable threshold. These notifications ensure that issues are addressed before they escalate.
Customizable time ranges are another essential feature. They allow users to zoom in on daily cash flow fluctuations or analyze longer-term trends. Many professional services firms find value in examining historical data for strategic planning and combining it with short-term forecasts for day-to-day management.
After customizing your dashboard, it's crucial to ensure it pulls accurate, up-to-date information from all relevant systems. Integrating financial and project data eliminates manual data entry and ensures real-time updates.
APIs play a vital role in automating updates between your accounting software and project management tools. For instance, when a project manager logs billable hours, that data should immediately reflect in revenue calculations and utilization metrics. Similarly, when finance issues an invoice, the dashboard should update accounts receivable and project-specific revenue figures without delay.
To avoid data silos, maintain consistent naming conventions across all systems. If a client is listed as "TechCorp Solutions Inc." in your CRM, use the same name in your accounting and project management tools to ensure data accuracy.
Integration with time tracking is especially valuable. When consultants log billable hours, the dashboard can automatically calculate revenue recognition based on your firm's policies - whether it's milestone-based for fixed-fee projects or time-based for time-and-materials engagements.
Expense tracking is just as important. Automatically channeling costs like travel, subcontractor fees, or software licenses into project cost calculations gives project managers a clearer view of profitability. This helps them make informed decisions about resource allocation and scope adjustments.
Lastly, set up data validation rules to catch and flag inconsistencies, prompting immediate review and correction.
Once your dashboards are up and running, consistent monitoring is key to turning insights into action. Establish regular review schedules: daily checks for cash positions and urgent collections, weekly reviews for project performance, and monthly evaluations to identify trends and refine strategies. Use benchmarks and scenario modeling to guide adjustments when needed.
Compare your performance against internal targets and industry standards. For example, a sudden increase in days sales outstanding might point to market challenges or specific collection issues that require immediate attention.
Dashboards also simplify scenario planning. With robust data at your fingertips, you can simulate various situations and develop contingency plans accordingly.
Finally, make sure alerts lead to action, not just notifications. When metrics fall below acceptable thresholds, having predetermined escalation procedures ensures swift corrective measures. Regularly review and update metric definitions to keep your dashboards aligned with changing business goals and priorities.
When it comes to cash flow dashboards, there’s a lot to unpack. These tools can be game-changers for professional services firms, offering clear advantages - but they’re not without their challenges. By weighing the pros and cons, you’ll be in a better position to decide if they’re the right fit for your business and how to manage them effectively.
One of the standout benefits is real-time visibility into your financial health. Forget waiting for monthly reports or crunching numbers manually - automated updates give you instant access to your current cash position. This immediate insight allows you to make faster, more informed decisions while minimizing the risk of cash flow surprises.
Another major perk is improved forecasting. By combining historical data with current trends, these dashboards help you predict future cash positions more accurately. This is especially valuable for project-based businesses where financial timing can be unpredictable.
But, as with anything, there are hurdles to consider. The accuracy of these dashboards hinges on the quality of the data feeding into them. If your data isn’t up-to-date or contains errors, the insights you rely on could lead to poor decisions. Additionally, the setup process can be intimidating. For firms transitioning from manual methods, creating a fully functional dashboard often requires a hefty upfront investment in time, resources, and potentially new technology.
Let’s break it down further:
| Benefits | Challenges |
|---|---|
| Real-time visibility – Automated updates provide immediate access to current balances | Data accuracy dependencies – Errors in underlying data can undermine dashboard reliability |
| Improved forecasting – Historical trends and current data enable better cash flow predictions | Partial automation limitations – Some elements, like expected revenues, may still need manual input |
| Automated data integration – Connects directly to bank accounts and accounting software for seamless updates | Complex configuration requirements – Initial setup can be time-consuming and resource-intensive |
This table highlights the trade-offs you’ll need to navigate. The good news? With the right tools, many of these challenges can be minimized. For instance, specialized cash flow software that integrates directly with your bank accounts and accounting systems can automate daily updates, reducing the risk of outdated or incomplete data. If you’re still relying on Excel, the contrast is stark - manual processes often result in lagging insights, while dedicated dashboards keep you up to speed in real time.
Customization is key to getting the most out of your dashboard. Different roles within your organization have different needs. A CEO might prefer a high-level overview, while a project manager will benefit from more granular performance metrics. Tailoring the dashboard to its audience ensures it delivers the right information without overwhelming users with unnecessary details.
Cash flow dashboards transform financial management by shifting the focus from reacting to problems to planning ahead. These tools offer real-time insights into revenue, invoices, and cash positions, making it easier to track profitability and make informed decisions.
The first step is to establish a solid foundation by identifying project inflows and estimating outflows. This groundwork ensures that decisions are guided by accurate, data-driven insights.
The most effective dashboards are tailored to highlight key metrics like revenue pipelines, open invoices, and profitability. With tools that allow customization, businesses can design views that align with their financial goals. This approach ensures clarity on income streams and liquidity without overwhelming users with unnecessary details.
A well-designed dashboard supports precise cost-benefit analyses, clarifies payment terms, and provides thorough documentation, helping businesses stay competitive. Over time, this strategic approach to managing project revenue builds a lasting advantage.
For growth-stage companies aiming to scale, working with financial experts can simplify dashboard setup and improve results. Phoenix Strategy Group specializes in creating strong financial systems, including cash flow forecasting and KPI development, to support strategic decisions and prepare businesses for funding or exit opportunities.
While setting up cash flow dashboards requires an initial investment of time and effort, the long-term benefits are undeniable. Improved forecasting, faster decision-making, and fewer financial surprises make these tools indispensable for sustainable growth.
Cash flow dashboards work hand-in-hand with accounting systems, thanks to APIs that sync data in real time. This real-time connection ensures precise financial tracking by securely pulling in key data points like revenue, expenses, and cash movements.
These dashboards also integrate with project management tools, making it easier to track cash flow for specific projects. This gives businesses a clear breakdown of project-related revenue and expenses. By simplifying cash flow tracking and improving forecasting accuracy, these integrations help professional services firms make smarter financial decisions.
A cash flow dashboard is a valuable tool for project-based businesses to keep a clear view of their financial health. It tracks critical metrics such as cash inflows and outflows, current cash balances, and cash flow forecasts. By keeping an eye on these numbers, businesses can better prepare for funding needs and steer clear of cash shortages.
It also offers insights into key indicators like the cash burn rate and liquidity ratios, helping you understand how quickly cash is being spent and whether your business can meet short-term financial obligations. These metrics play a crucial role in ensuring financial stability and guiding smart decisions about project revenues and expenses.
Setting up a cash flow dashboard isn’t always straightforward. Challenges like irregular revenue streams, late payments from clients, and the hassle of manually piecing together financial data can make the process frustrating. These issues often result in errors or delays, leaving you without the timely insights you need.
The solution? Automate data collection, bring together information from multiple sources, and establish standardized processes. This approach ensures accurate, real-time tracking of your finances. For professional services firms, this means gaining a clear view of project revenues and making smarter decisions to keep cash flow under control.