Published on
June 26, 2026


If your finance team waits until month-end, you’re often making decisions with numbers that are 15 to 30 days old. I’d sum up the fix like this: connect your ERP, bank, CRM, and payroll data, clean the inputs, lock KPI definitions, and let AI update cash on hand, MRR, ARR, burn, runway, collections, pipeline, and headcount in near real time.
Here’s the core idea in plain English:
What matters most is not the dashboard screen. It’s the system behind it. I need clean source data, one definition for each KPI, role-based access, audit logs, and alerts that tell me what changed, why it matters, and who needs to act.
At a high level, the article shows how to:
A good real-time finance dashboard does one job: it helps me answer “Where do we stand right now?” without exports, spreadsheet stitching, or last-minute number debates.
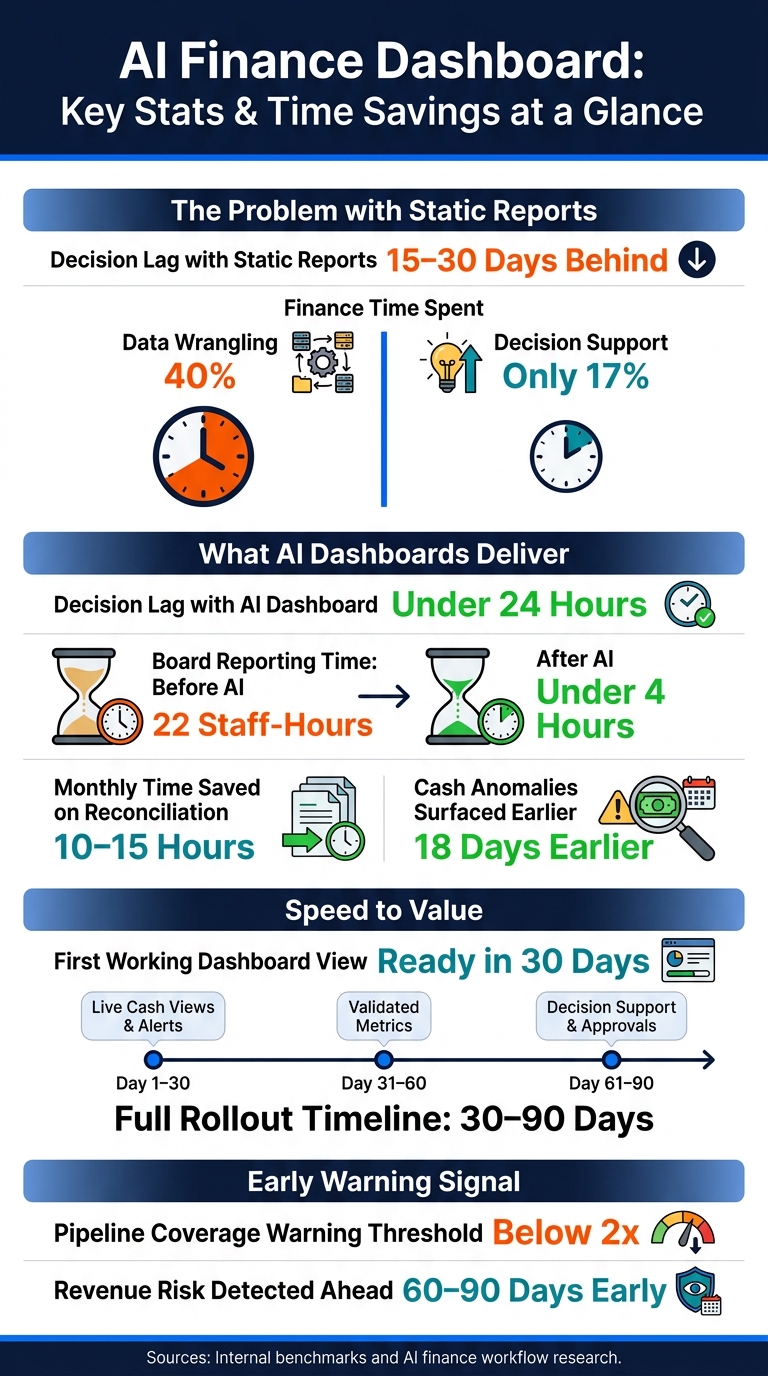
AI Finance Dashboard: Key Stats & Time Savings at a Glance
An AI-powered real-time finance dashboard turns live finance data into current metrics, anomaly alerts, and action prompts. As new transactions come in, the dashboard updates with them. But that only happens when the source data is connected and normalized.
The main shift is decision lag: how long it takes for a changed number to reach the person who needs to act on it. Static reports often leave finance teams 15 to 30 days behind. A well-built AI dashboard can cut that lag to under 24 hours for key metrics [1][5].
It starts with clean, connected data. In this stage, information usually lives across siloed systems, which makes it hard to trust a single version of the truth [6]. Static reports can show what changed, sure. But spotting a cost overrun or missed deal six weeks late is a very different problem from spotting it in three days [6].
Finance teams in this range also spend about 40% of their time on data wrangling and only 17% on actual decision support [5]. That’s backwards for a growth-stage company.
AI takes care of repetitive finance work, so teams spend less time getting reports ready and more time acting on them. That includes:
AI-driven board reporting can cut prep time from 22 staff-hours to under 4, while real-time dashboards surface cash anomalies about 18 days earlier [4].
Next, connect the source systems and normalize the data that feeds these outputs.
Connect the four core systems behind weekly reporting: ERP, banks, CRM, and payroll/HRIS. Start with the ones tied to cash, revenue, and headcount.
| Source System | What It Owns | System of Record For |
|---|---|---|
| ERP / Accounting | General ledger, P&L, AP, AR | Reconciled financial reporting |
| Bank accounts | Cash settlements | Cash settlements and real-time cash positioning |
| CRM | Sales pipeline probabilities and bookings | Sales pipeline probabilities and bookings |
| Payroll / HRIS | Headcount | Headcount |
Your primary ledger is the source of truth for anything that must reconcile to financial reporting. Banks own cash. CRM owns pipeline. Clear lines here matter a lot. If you blur them, the same number can show up two different ways in two different places.
The hard part isn't the first sync. It's keeping everything lined up after that.
AI can watch connector health, suggest chart of accounts mappings, and link customer, invoice, and deal IDs so revenue, cash, and pipeline stay in step. Every metric should tie back to its system of record so each figure can be traced to a source transaction. Once those feeds line up, lock the metric logic before you build the dashboard view.
Start with read-only API access across your core systems. That gives you room to prove accuracy and check AI-suggested mappings before write-back [1].
A focused first 30 days - connecting only the bank, ERP, and CRM - can deliver live cash views and anomaly alerts fast [1]. Next, clean the data and define the KPI rules finance will trust.
Once the feeds are connected, the next job is simple to describe and hard to fake: make sure the numbers are clean and that every team uses the same definitions.
Most data problems aren't dramatic. They're the small, annoying ones that pile up over time: a vendor billed twice under slightly different names, an expense coded to the wrong department, an invoice missing its ID, or a spend spike nobody flagged. Rules catch known errors. AI spots odd patterns and anomalies that don't fit the usual mold.
AI flags the issue and explains why it matters; finance approves the correction. Automated reconciliation and error detection can save finance teams 10–15 hours per month [2] - time that goes back into analysis instead of matching entries by hand.
The biggest source of metric confusion is competing definitions. Gross margin means one thing in the ERP and something a little different in the spreadsheet a VP built six months ago. ARR gets calculated three ways depending on who's presenting.
Define each KPI once in a shared metric layer so ARR, gross margin, burn, runway, and collections match across teams. AI can draft the formula from a plain-English definition; finance validates it against ERP reports and bank balances [1]. Set those definitions early so metrics don't drift as the company grows.
With clean inputs and shared definitions, the weekly dashboard can show one version of each KPI.
A dashboard only helps if founders and CFOs can read it fast and trust what they’re seeing. Once your data is clean and your metric definitions are locked, the next move is simple: decide which few numbers deserve screen space.
The aim is a dashboard you can scan in 10 seconds and know if the business is on track [7]. That usually means stripping out clutter and grouping the view into six buckets:
For B2B companies, pipeline coverage below 2x is an early warning sign. It can point to revenue risk 60 to 90 days out [7]. That should be obvious at a glance, not buried three clicks deep.
Use the same buckets across the business, but change how deep each view goes. A CEO doesn’t need line-by-line reconciliation. Finance does. Department leaders need views tied to their own budgets, projects, and team performance.
| Dashboard Tab | Primary Metrics | Source Systems | Refresh Frequency |
|---|---|---|---|
| Executive Summary | Cash position, net burn, runway, ARR, pipeline coverage | ERP, bank, CRM | Daily / Weekly |
| Finance Ops | AR/AP aging, restricted cash, payroll, gross margin | ERP, AP/AR, payments | Hourly / Daily |
| Sales & Pipeline | New deals, stalled deals (>14 days), bookings forecast | CRM | Real-time / Daily |
| Dept / Project | OpEx by department, project utilization, project status | ERP, project tools | Weekly |
Every tab should pull from the same metric layer. That way, Sales sees the same ARR number Finance sees. No last-minute number fights before a board meeting.
Once the views are set, automate the weekly story around them. AI can turn the dashboard into a plain-English briefing that explains what changed, what matters, and what needs action. When this is done well, it cuts a 3-hour reporting process down to a 3-minute read.
The catch? AI needs context. Give it a context pack with normal ranges for each metric, current company priorities, and known exceptions, like a client on a non-standard payment cycle. Without that, it tends to flag noise instead of signal [3].
With the views and summaries in place, the next step is setting up alerts and access control.
A clean dashboard with trusted metrics can still miss the mark if no one knows when something breaks. That’s where alerts, access controls, and a phased rollout come in. They turn a dashboard from a reporting screen into something teams use day to day.
Once the dashboard shows numbers people trust, the next step is simple: turn exceptions into action.
Use three alert layers: threshold, anomaly, and variance explanation.
| Alert Type | Best Use Case | Setup Complexity | Sensitivity to Noise |
|---|---|---|---|
| Threshold-based | Known KPIs (e.g., Cash < $500,000, Burn > $100,000) | Low (static rules) | Low (clear triggers) |
| Anomaly-based | Fraud detection, duplicate payments, GL errors | Medium (requires ML training) | Medium (needs calibration) |
| Variance explanation | Explaining variance drivers (price/volume/mix) | High (requires grounding) | High (requires grounding) |
Threshold alerts fire when a metric crosses a hard line. Say cash runway drops below six months. That can trigger a hiring freeze [2]. Clear rule, clear action.
Anomaly alerts work a bit differently. AI learns what “normal” looks like across vendors, amounts, and timing. Then it flags outliers like duplicate payments, suspicious GL postings, or vendor master changes [1].
Each alert should include a short why it matters note tied to cash, margin, or risk, not just a raw number [1]. It also needs an owner and a recommended next step. Otherwise, the alert just sits there and collects dust. Automation can handle 98% of routine dashboard updates through scheduled refreshes and anomaly detection [2].
Once alerts are in place, the next move is locking down who can see and change each data domain.
Not everyone should have access to salary data, equity schedules, or bank balances. Role-based access keeps sensitive data in the right hands. HR and Finance leads own payroll views, the Controller owns AP, and the fractional CFO or Treasurer owns cash [1]. Test and live environments should stay separate too.
Log every AI decision, model update, and user approval in an immutable trail [1]. That gives auditors a clear record of what happened and when. Document U.S. GAAP and revenue recognition rules with versioned instructions and stored support [1]. That way, board reporting, lender updates, and close work all point to the same numbers.
| Data Domain | System of Record | AI Use | Control Owner | Review Frequency |
|---|---|---|---|---|
| Cash/Banking | Bank APIs / ERP | Cash flow forecasting | Treasurer / CFO | Daily |
| Accounts Payable | ERP / Bill.com | Anomaly/fraud detection | Controller | Weekly |
| Revenue/Sales | CRM / Stripe | Variance analysis | VP of Finance | Weekly |
| Payroll | ADP / Gusto | Access control/audit | HR / Finance Lead | Monthly |
The fastest path is usually the safest one: start with visibility, then add approvals and write-backs only after the live numbers hold up.
A practical rollout follows a 30-60-90 day structure. In the first 30 days, deploy read-only live cash views and anomaly alerts on AP/AR before turning on automated write-backs or system updates [1]. Between days 60 and 90, add decision support: in-line approvals, draft journal entries for flux analysis, and prioritized collections workflows [1].
Keep the rollout phased. Keep version one read-only. Then expand only after the numbers match the books.
AI-powered finance dashboards can be highly accurate when they run on unified, automated data pipelines. That setup cuts down on manual input, which is often where mistakes creep in.
Accuracy comes down to a few core things: strong data validation, standard metric definitions, one system of record for each data point, and automated daily or real-time reconciliation. Phoenix Strategy Group puts extra focus on these steps so leadership has a source of truth they can trust.
Start with 5 to 7 primary KPIs that fit your company’s growth stage.
For most businesses, that means keeping a close eye on:
To get a better read on liquidity, track DSO and DPO too.
If you run a SaaS business, put extra focus on NRR and burn multiple.
Keep your first dashboard tight and easy to scan. Then review it every quarter as your goals change.
Use role-based access so each person sees only the data tied to their job. Keep clear audit trails that show data lineage and log every pipeline run with a unique ID.
When you connect systems, rely on secure APIs or managed ETL tools. For companies that follow SOX, IFRS, or ASC 606, these steps also tighten internal controls and make audits easier to support.