Published on
July 5, 2026

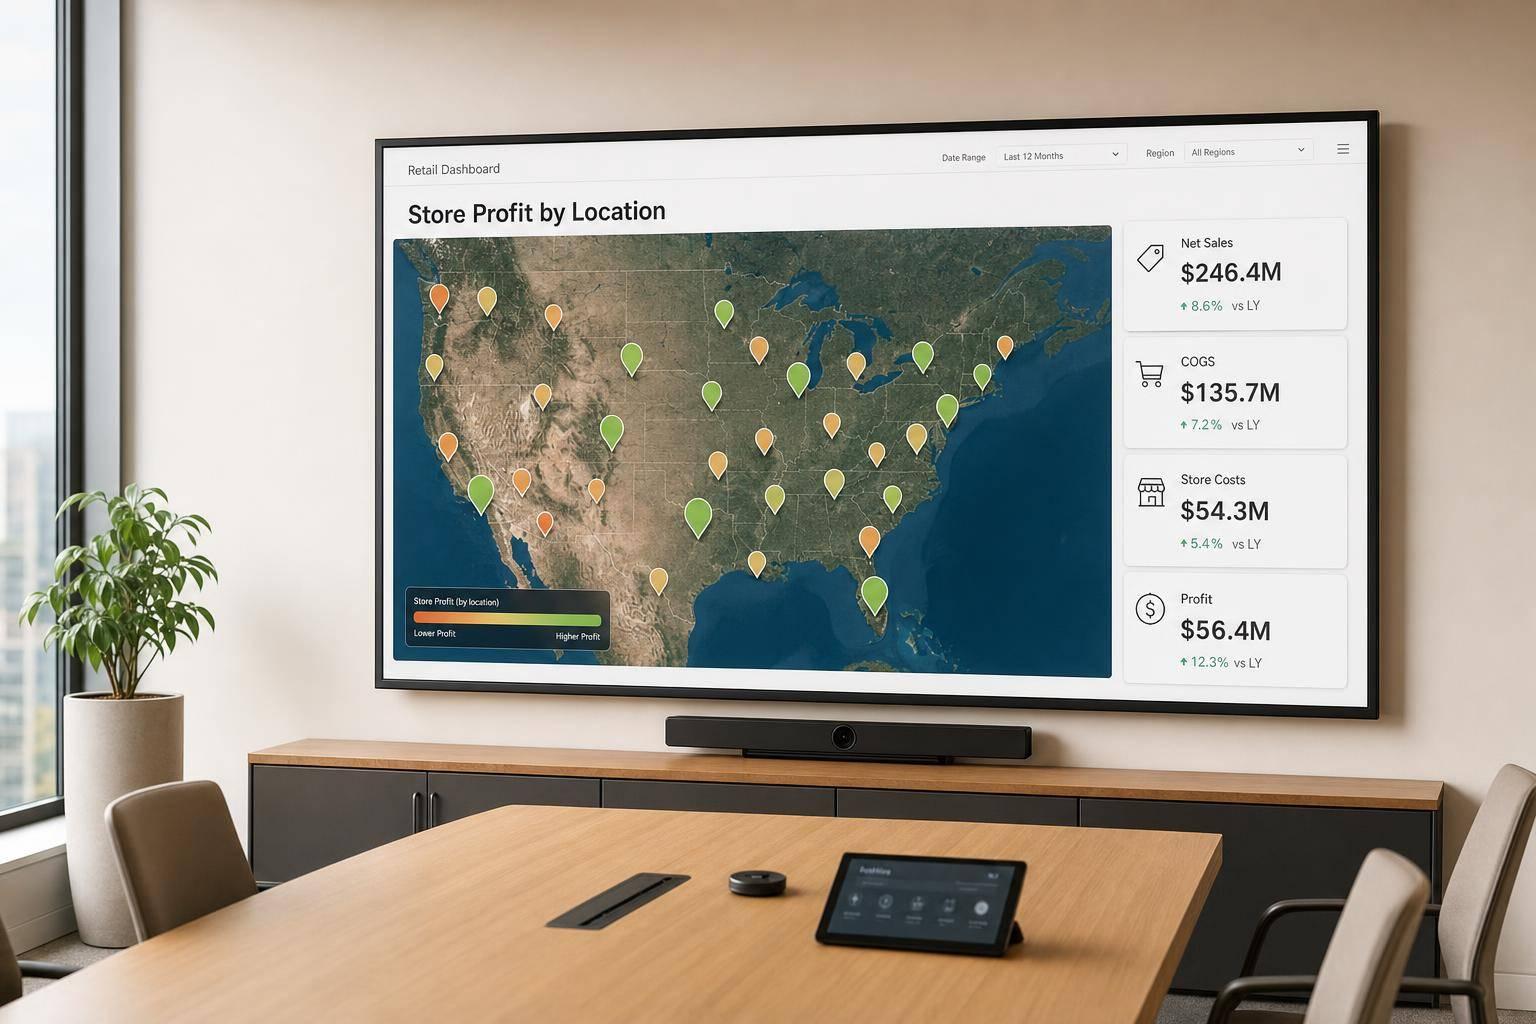
A store is not making money just because sales look strong. I need two numbers to judge a location: gross profit and store contribution margin. The first shows sales minus product cost. The second shows what is left after store costs like rent, labor, payment fees, and local marketing.
Here’s the short version:
A few numbers matter a lot here. BNPL fees can run from 2% to 8% per transaction, and one multi-store group looked fine in total even though most of its 12 stores were losing money. That’s why store-level math matters.
If I want a dashboard that helps me act, I keep it focused on clean inputs, one P&L structure for every store, and a close process that catches errors before the report goes out.
| KPI Area | What I track | Why it matters |
|---|---|---|
| Revenue | Gross sales, discounts, returns, same-store sales | Shows demand and revenue leakage |
| COGS | Product cost, freight, shrink, write-downs | Shows true gross margin |
| Occupancy | Rent, CAM, tax passthroughs, insurance | Shows location cost burden |
| Labor | Wages, overtime, taxes, temp staffing | Shows store-level staffing cost |
| Direct expenses | Card fees, BNPL fees, local marketing | Shows margin drag by store |
| Final outputs | Gross profit, store contribution margin | Shows whether a store earns money |
That’s the full picture in plain terms: sales tell me volume, but margin tells me whether the store works.
Record revenue and COGS in the same period and at the same location. If you don’t, gross margin stops telling you how the store is doing. It starts moving because of timing gaps or category mix-ups instead of actual store performance.
For a store P&L, the cleanest way to look at revenue is usually net sales excluding taxes. Keep gross sales, discounts, returns, gift card redemptions, and sales tax in separate fields so managers can see exactly where revenue is being reduced or pushed out to a later period [4].
That separation matters more than it may seem. If everything gets blended together, it’s hard to tell whether a store has a pricing problem, a return problem, or just a reporting issue.
Same-store sales should include only comparable stores. That means leaving out new stores, recently closed stores, relocated stores, or stores that went through major remodels. The goal is simple: measure like-for-like growth, not noise from openings, closures, or remodel activity [4].
| Revenue Input | Treatment | Why It Matters |
|---|---|---|
| Gross Sales | Total before deductions | Measures raw demand at the location |
| Discounts & Returns | Separate line items, not netted | Surfaces pricing and quality issues |
| Sales Tax | Excluded from management P&L | Not revenue - it belongs to tax authorities |
| Gift Card Redemptions | Track separately from sales; do not mix with net sales | Keeps net sales clean |
| Same-Store Sales | Comparable locations only | Tracks organic growth on a consistent base |
Store-level COGS should include product cost, freight or landed cost, shrinkage, spoilage, and inventory write-downs [4] [5]. Each cost should be tagged to the store where it happened. That keeps location-level margin reporting clean and makes store-to-store comparisons much more useful.
Shrinkage deserves its own tracking by store. It can point to weak controls or theft issues that disappear when you only look at rolled-up reporting.
Use one COGS definition across all stores. If one location includes shrinkage in COGS and another doesn’t, gross margin comparisons fall apart fast.
After gross margin, capture rent, labor, fees, and local marketing to calculate store contribution margin.
Track only store-level costs that sit below gross profit. Use the same store ID and reporting period as gross margin so these costs roll into contribution margin without a mess.
Base rent is just the starting point. Commercial leases can also include Common Area Maintenance (CAM) charges, property tax passthroughs, insurance contributions, and percentage rent clauses [2][3]. Those items belong on the store P&L too.
If you have shared occupancy costs, use one fixed driver to split them. Square footage works well. A flat fee can work too. The main thing is to stay consistent.
Next up is labor, which is often the biggest store cost you can control.
Track wages, overtime, bonuses, payroll taxes, and temp or contract labor by store.
That sounds simple, but it matters more than people think. If labor isn't tagged to the right location, store profit can look better or worse than it is.
Then move to transaction costs and local spend. These can skew store profit fast when they aren't tied to the right location.
Record card processing fees by location, and split them by tender type when your processor allows it. Also note that Buy Now, Pay Later (BNPL) providers charge merchants between 2% and 8% per transaction [6], which is higher than standard credit card fees.
For local marketing, track the spend that belongs to that store: neighborhood ads, direct mail, in-store events, and store-specific promotions. Leave out corporate campaigns unless you already have a clear allocation rule. When local and corporate spend get mixed together, store ROI and margin reporting get distorted.
| Operating Cost Category | Line Items to Track | Notes |
|---|---|---|
| Occupancy | Base rent, CAM, property tax passthroughs, insurance, percentage rent | Use square footage or a flat fee for shared costs |
| Labor | Wages, overtime, payroll taxes, bonuses, temp/contract staffing | Tag every labor cost to the store where the work occurred |
| Payment Fees | Card processing fees by tender type, BNPL fees | BNPL fees (2%–8%) are higher than standard card fees [6] |
| Local Marketing | Neighborhood ads, direct mail, store events, store-specific promotions | Exclude corporate campaigns unless a clear allocation rule exists |
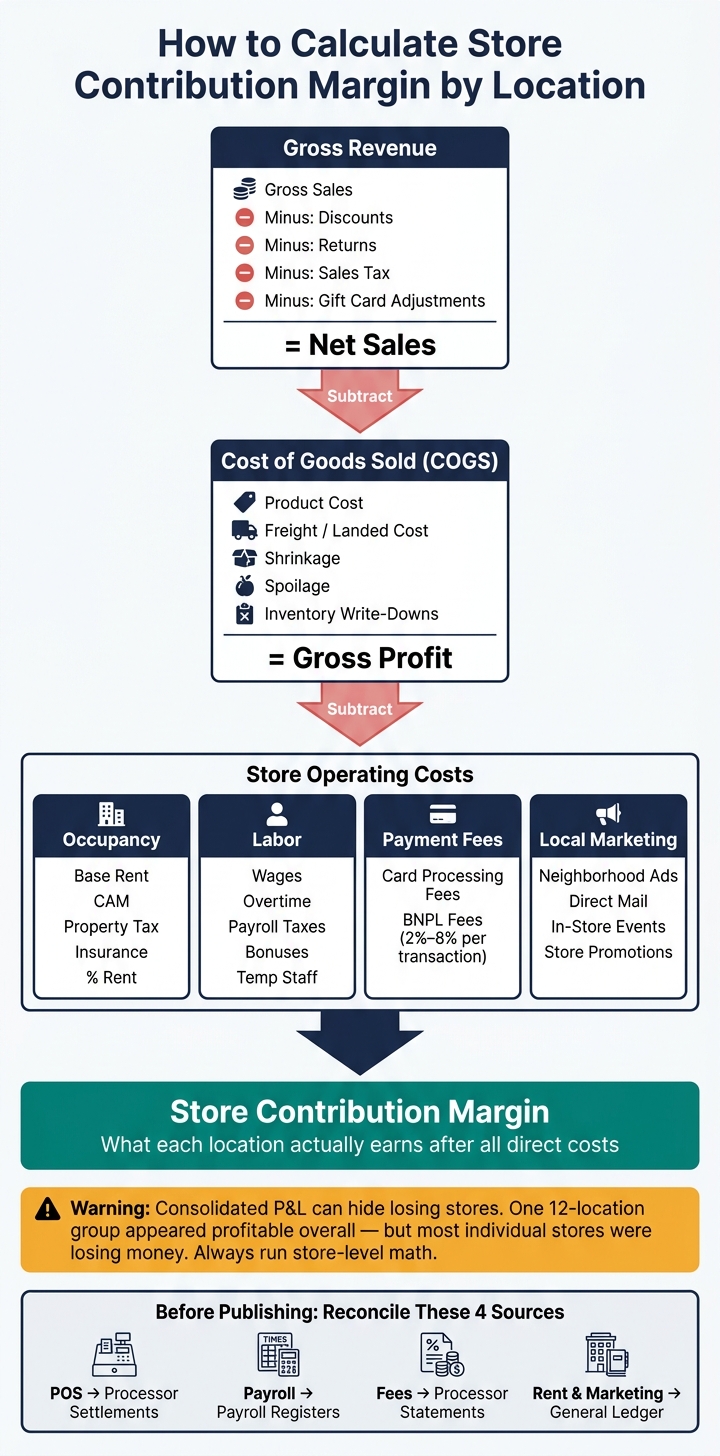
Store Profit by Location: P&L Flow from Gross Sales to Contribution Margin
Once revenue, COGS, and operating costs are in place, use the same math for every store.
Each location should run through the same P&L flow: start with gross revenue, subtract direct COGS to get gross profit, then subtract occupancy, labor, payment fees, and local marketing to land on store contribution margin.
This matters more than it might seem. If you skip store-level reporting, weak locations can disappear inside group totals. One 12-location group looked profitable on a consolidated basis, even though most of its stores were losing money [1].
That’s the trap: a consolidated P&L can blur the picture, while a store-level P&L shows what each site is actually doing.
To make that work, tag every transaction at entry with the same store ID and the same chart of accounts.
And there’s a catch. This setup only holds up if every source system lines up before the close.
Don’t publish the dashboard until the close controls are done. Before a store P&L goes out, tie POS sales to processor settlements, payroll to payroll registers, fees to processor statements, and rent and marketing to the general ledger [7].
An exceptions log helps keep things from slipping through the cracks. Track refunds, chargebacks, and unresolved discrepancies, and assign each one an owner and a due date. That keeps the monthly close checklist moving [7].
A simple cadence works well here:
At some point, multi-location reporting can outgrow the team’s time and systems. When that happens, Phoenix Strategy Group supports bookkeeping, FP&A, data engineering, and fractional CFO work.
Once store IDs, timing, and mapping rules are consistent, store profit reporting only works if the inputs are complete and tagged the same way every time. That means revenue, COGS, occupancy, labor, payment fees, and local marketing all need to be tied to the right store and the right reporting period.
Use this minimum-input checklist to keep store margins aligned across locations.
| Category | Minimum Inputs Required |
|---|---|
| Revenue | Gross sales, discounts, returns, same-store sales growth |
| COGS | Product cost, shrinkage, inventory write-downs |
| Occupancy | Base rent, CAM charges, property taxes, insurance |
| Labor | Payroll, taxes, overtime, temporary staffing |
| Direct Expenses | Payment processing fees, local marketing spend |
Gross margin helps you spot pricing problems and waste. Store contribution margin shows what each location brings in after direct store costs. With clean inputs, steady math, and a disciplined close process, location decisions become much easier to act on.
Store contribution margin shows how much profit a single location makes before you factor in centralized, off-site costs like corporate overhead, head office rent, or shared warehousing fees.
It focuses on the costs a store can directly control - things like on-site labor, rent, utilities, and local marketing. That makes it a simple way to see a store’s actual performance.
In plain English: it helps you spot which locations are bringing in cash and which ones are falling behind.
Gross sales can fool you. On paper, a store may look strong, but that top-line number leaves out what it takes to keep that location open, like rent, labor, and occupancy costs. And those costs can swing a lot from one store to the next.
Without margin data and store-level cost details, you can’t see if a location is just busy or if it’s making money. That blind spot makes it tougher to catch cash flow problems early and harder to know where to invest more - or where it may be time to pull back.
Review store profit by location on a weekly, monthly, and quarterly schedule. The best rhythm depends on how fast your team needs to act.
For most businesses, monthly and quarterly reviews are the standard for P&L reporting. At the same time, dashboards might update daily for high-volume retail or weekly for steadier, project-based models.
Phoenix Strategy Group recommends setting a clear data cutoff and reviewing unmapped items each week to keep reporting consistent and accurate.